HP StorageWorks 2/16V Brocade Fabric Manager Administrator's Guide (53-1000019 - Page 131
Granularity, Reports, Table 8-1, Samples, Time Covered in Stored Samples
 |
View all HP StorageWorks 2/16V manuals
Add to My Manuals
Save this manual to your list of manuals |
Page 131 highlights
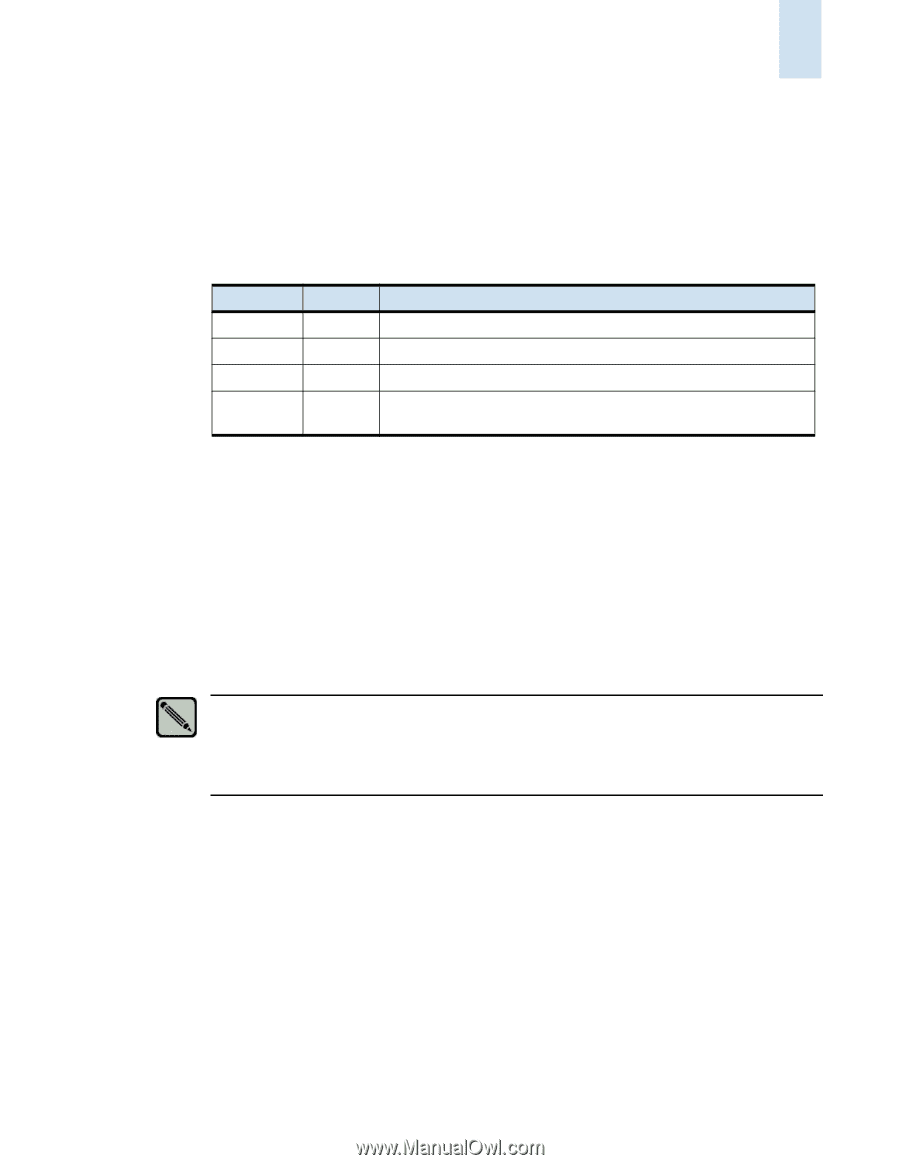
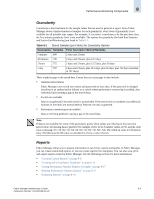
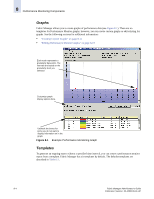
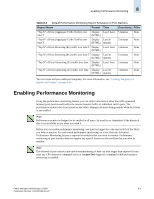
Performance Monitoring Components 8 Granularity Granularity is the timeframe for the sample values that are used to generate a report. Since Fabric Manager stores a limited number of samples for each granularity, every level of granularity is not available for all possible time ranges. For example, if you select a timeframe to be the past three days, the five-minute granularity level is not available. The options for granularity (for both Port Statistics and End-to-End Monitoring) are listed in Table 8-1. Table 8-1 Stored Samples (per Fabric) for Granularity Options Granularity Samples Time Covered in Stored Samples 5 minutes 600 2 days and 2 hours 30 minutes 700 2 days and 2 hours, plus 12.5 days 2 hours 775 2 days and 2 hours, plus 12.5 days, plus 50 days 1 day 797 2 days and 2 hours, plus 12.5 days, plus 50 days, plus 732 days (rounded to 797 days) There might be gaps in the stored data. Events that can cause gaps in data include: • Authentication failures Fabric Manager uses switch user names and passwords to store data. If the password is changed (resulting in an authentication failure) on a switch where performance monitoring is enabled, data collection fails (creating a gap in the stored data). • Switch not reachable Data is not gathered if the seed switch is unreachable. If the seed switch is reachable, but additional switches in the fabric are unreachable by Ethernet, the data is gathered. • Performance monitoring is not enabled Data is not being gathered, causing a gap in the stored data. Note If data is not available for some of the granularity points when values are rolled up to the next time period value, the missing data is ignored. For example, if five of six 5-minute values are 50, and the sixth value is missing: N1= 50, N2= 50, N3=50, N4= 50, N5= 50, N6= NA. The rolled up value for 30-minute entry=250 (because the N6 value is calculated as if it is a value of zero). Reports Fabric Manager allows you to present information in two forms: reports and graphs. In Fabric Manager, you can create customized reports, or you can create reports from templates. You can also save, print, and export reports created in Fabric Manager. See the following sections for more information: • "Creating Custom Reports" on page 8-8 • "Creating and Using Report Templates" on page 8-13 • "Saving Performance Monitor Reports or Graphs" on page 8-17 • "Printing Performance Monitor Reports" on page 8-17 • "Exporting Reports" on page 8-18 Fabric Manager Administrator's Guide 8-3 Publication Number: 53-1000196-01-HP
-
 1
1 -
2
-
3
-
4
-
5
-
6
-
7
-
8
-
9
-
10
-
11
-
12
-
13
-
14
-
15
-
16
-
17
-
18
-
19
-
20
-
21
-
22
-
23
-
24
-
25
-
26
-
27
-
28
-
29
-
30
-
31
-
32
-
33
-
34
-
35
-
36
-
37
-
38
-
39
-
40
-
41
-
42
-
43
-
44
-
45
-
46
-
47
-
48
-
49
-
50
-
51
-
52
-
53
-
54
-
55
-
56
-
57
-
58
-
59
-
60
-
61
-
62
-
63
-
64
-
65
-
66
-
67
-
68
-
69
-
70
-
71
-
72
-
73
-
74
-
75
-
76
-
77
-
78
-
79
-
80
-
81
-
82
-
83
-
84
-
85
-
86
-
87
-
88
-
89
-
90
-
91
-
92
-
93
-
94
-
95
-
96
-
97
-
98
-
99
-
100
-
101
-
102
-
103
-
104
-
105
-
106
-
107
-
108
-
109
-
110
-
111
-
112
-
113
-
114
-
115
-
116
-
117
-
118
-
119
-
120
-
121
-
122
-
123
-
124
-
125
-
 126
126 -
 127
127 -
 128
128 -
 129
129 -
 130
130 -
 131
131 -
 132
132 -
 133
133 -
 134
134 -
 135
135 -
 136
136 -
137
-
138
-
139
-
140
-
141
-
142
-
143
-
144
-
145
-
146
-
147
-
148
-
149
-
150
-
151
-
152
-
153
-
154
-
155
-
156
-
157
-
158
-
159
-
160
-
161
-
162
-
163
-
164
-
165
-
166
-
167
-
168
-
169
-
170
-
171
-
172
-
173
-
174
-
175
-
176
-
177
-
178
-
179
-
180
-
181
-
182
-
183
-
184
-
185
-
186
-
187
-
188
-
189
-
190
-
191
-
192
-
193
-
194
-
195
-
196
-
197
-
198
-
199
-
200
-
201
-
202
-
203
-
204
-
205
-
206
-
207
-
208
-
209
-
210
-
211
-
212
-
213
-
214
-
215
-
216
-
217
-
218
-
219
-
220
-
221
-
222
-
223
-
224
-
225
-
226
-
227
-
228
-
229
-
230
-
231
-
232
-
233
-
234
-
235
-
236
-
237
-
238
-
239
-
240
-
241
-
242
-
243
-
244
-
245
-
246
-
247
-
248
-
249
-
250
-
251
-
252
-
253
-
254
-
255
-
256
-
257
-
258
-
259
-
260
-
261
-
262
-
263
-
264
-
265
-
266
-
267
-
268
-
269
-
270
-
271
-
272
-
273
-
274
-
275
-
276
-
277
-
278
-
279
-
280
-
281
-
282
-
283
-
284
-
285
-
286
-
287
-
288
-
289
-
290
-
291
-
292
-
293
-
294
-
295
-
296
-
297
-
298
-
299
-
300
-
301
-
302
-
303
-
304
-
305
-
306
-
307
-
308
-
309
-
310
-
311
-
312
-
313
-
314
-
315
-
316
-
317
-
318
-
319
-
320
-
321
-
322
-
323
-
324
-
325
-
326
-
327
-
328
-
329
-
330
-
331
-
332
-
333
-
334
-
335
-
336
-
337
-
338
-
339
-
340
-
341
-
342
-
343
-
344
-
345
-
346
-
347
-
348
-
349
-
350
-
351
-
352
-
353
-
354
-
355
-
356
-
357
-
358
-
359
-
360
-
361
-
362
-
363
-
364
-
365
-
366
-
367
-
368
-
369
-
370
-
371
-
372
-
373
-
374
-
375
-
376
-
377
-
378
-
379
-
380
-
381
-
382
-
383
-
384
-
385
-
386
-
387
-
388
-
389
-
390
-
391
-
392
-
393
-
394
-
395
-
396
-
397
-
398
-
399
-
400
-
401
-
402
-
403
-
404
-
405
-
406
 |
 |