HP StorageWorks 2/16V Brocade Fabric Manager Administrator's Guide (53-1000019 - Page 130
Performance Monitoring Components, Port Statistics, End-to-End Monitoring
 |
View all HP StorageWorks 2/16V manuals
Add to My Manuals
Save this manual to your list of manuals |
Page 130 highlights
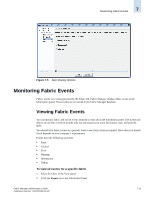
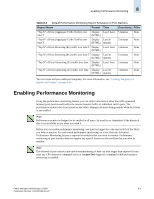
8 Performance Monitoring Components Performance Monitoring Components Before you start using performance monitoring on your fabric, you need to be familiar with the following components: • "Port Statistics" on page 8-2 • "End-to-End Monitoring" on page 8-2 • "Granularity" on page 8-3 • "Reports" on page 8-3 • "Graphs" on page 8-4 • "Templates" on page 8-4 Port Statistics The port statistics component within the performance monitoring feature in Fabric Manager allows you to see how much traffic a particular port is generating on a fabric over a period of time. The receive (RX) and transmit (TX) values for ports are retrieved over a specific timeframe and stored in a database. Monitoring port statistics does not require an Advanced Performance Monitoring license. End-to-End Monitoring End-to-end monitoring sets all possible target and initiator pairs from the filtered list retrieved from the API for the fabric. Fabric Manager stores the configuration of the monitors persistently and periodically re-creates them on the fabric as necessary. Each time the Fabric Manager server retrieves the monitor values, it checks for and re-creates any monitors (configured through Fabric Manager) that are no longer present. If a resource limit is reached while trying to set all of the possible pairs, performance monitoring does not attempt to determine the best set of monitors. Instead, monitors are set on a firstcome, first-serve basis (in the order presented to Fabric Manager from the API). Configuration of data capture file information is not supported. The monitor values for the end-to-end monitors are retrieved at a set interval (that is not configurable) and stored in the database from the previous release. You can then request that reports be generated from the stored data (see "Generating Custom Reports and Graphs" on page 8-7). Fabric Manager attempts to set the monitors between the following types of devices only: • initiator-target • initiator-unknown • target-unknown • initiator and target-any device role • unknown-any device role Monitors between initiator-initiator and target-target are not set. Monitors between all other device types are valid. Fabric Manager sets monitors in the fabric only if the total monitor count is 4000 or less. If the number of monitors is greater than 4000, monitors are not set on any ports. 8-2 Fabric Manager Administrator's Guide Publication Number: 53-1000196-01-HP
-
 1
1 -
2
-
3
-
4
-
5
-
6
-
7
-
8
-
9
-
10
-
11
-
12
-
13
-
14
-
15
-
16
-
17
-
18
-
19
-
20
-
21
-
22
-
23
-
24
-
25
-
26
-
27
-
28
-
29
-
30
-
31
-
32
-
33
-
34
-
35
-
36
-
37
-
38
-
39
-
40
-
41
-
42
-
43
-
44
-
45
-
46
-
47
-
48
-
49
-
50
-
51
-
52
-
53
-
54
-
55
-
56
-
57
-
58
-
59
-
60
-
61
-
62
-
63
-
64
-
65
-
66
-
67
-
68
-
69
-
70
-
71
-
72
-
73
-
74
-
75
-
76
-
77
-
78
-
79
-
80
-
81
-
82
-
83
-
84
-
85
-
86
-
87
-
88
-
89
-
90
-
91
-
92
-
93
-
94
-
95
-
96
-
97
-
98
-
99
-
100
-
101
-
102
-
103
-
104
-
105
-
106
-
107
-
108
-
109
-
110
-
111
-
112
-
113
-
114
-
115
-
116
-
117
-
118
-
119
-
120
-
121
-
122
-
123
-
124
-
 125
125 -
 126
126 -
 127
127 -
 128
128 -
 129
129 -
 130
130 -
 131
131 -
 132
132 -
 133
133 -
 134
134 -
 135
135 -
136
-
137
-
138
-
139
-
140
-
141
-
142
-
143
-
144
-
145
-
146
-
147
-
148
-
149
-
150
-
151
-
152
-
153
-
154
-
155
-
156
-
157
-
158
-
159
-
160
-
161
-
162
-
163
-
164
-
165
-
166
-
167
-
168
-
169
-
170
-
171
-
172
-
173
-
174
-
175
-
176
-
177
-
178
-
179
-
180
-
181
-
182
-
183
-
184
-
185
-
186
-
187
-
188
-
189
-
190
-
191
-
192
-
193
-
194
-
195
-
196
-
197
-
198
-
199
-
200
-
201
-
202
-
203
-
204
-
205
-
206
-
207
-
208
-
209
-
210
-
211
-
212
-
213
-
214
-
215
-
216
-
217
-
218
-
219
-
220
-
221
-
222
-
223
-
224
-
225
-
226
-
227
-
228
-
229
-
230
-
231
-
232
-
233
-
234
-
235
-
236
-
237
-
238
-
239
-
240
-
241
-
242
-
243
-
244
-
245
-
246
-
247
-
248
-
249
-
250
-
251
-
252
-
253
-
254
-
255
-
256
-
257
-
258
-
259
-
260
-
261
-
262
-
263
-
264
-
265
-
266
-
267
-
268
-
269
-
270
-
271
-
272
-
273
-
274
-
275
-
276
-
277
-
278
-
279
-
280
-
281
-
282
-
283
-
284
-
285
-
286
-
287
-
288
-
289
-
290
-
291
-
292
-
293
-
294
-
295
-
296
-
297
-
298
-
299
-
300
-
301
-
302
-
303
-
304
-
305
-
306
-
307
-
308
-
309
-
310
-
311
-
312
-
313
-
314
-
315
-
316
-
317
-
318
-
319
-
320
-
321
-
322
-
323
-
324
-
325
-
326
-
327
-
328
-
329
-
330
-
331
-
332
-
333
-
334
-
335
-
336
-
337
-
338
-
339
-
340
-
341
-
342
-
343
-
344
-
345
-
346
-
347
-
348
-
349
-
350
-
351
-
352
-
353
-
354
-
355
-
356
-
357
-
358
-
359
-
360
-
361
-
362
-
363
-
364
-
365
-
366
-
367
-
368
-
369
-
370
-
371
-
372
-
373
-
374
-
375
-
376
-
377
-
378
-
379
-
380
-
381
-
382
-
383
-
384
-
385
-
386
-
387
-
388
-
389
-
390
-
391
-
392
-
393
-
394
-
395
-
396
-
397
-
398
-
399
-
400
-
401
-
402
-
403
-
404
-
405
-
406
 |
 |