VMware 4817V62 Administration Guide - Page 227
Customize Storage Reports, Working with Storage Maps, Display Storage Maps
 |
View all VMware 4817V62 manuals
Add to My Manuals
Save this manual to your list of manuals |
Page 227 highlights
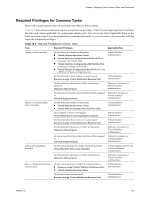
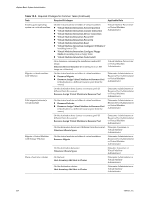
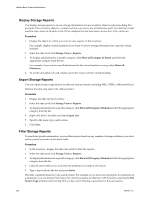
Chapter 19 Monitoring Storage Resources Customize Storage Reports You display storage reports in the vSphere Client. When you display the reports tables, the default column headings depend on the inventory object you select. You can customize the tables by adding or removing columns. Procedure 1 Display the object in the inventory for which you want to customize reports. 2 Select the object and click Storage Views > Reports. 3 To display information for a specific category, click Show all [Category of Items]and select the appropriate category from the list. 4 To add a column, right-click any column heading and select an item to display from the list. 5 To hide a column, right-click the column heading and deselect it in the list. Working with Storage Maps Storage maps help you visually represent and understand the relationships between an inventory object and all virtual and physical storage resources available for this object. Map views are object-centric and display only items relevant to the specific object. Map views are updated every 30 minutes. You can manually update the maps by clicking the Update link. You can customize a map view by selecting or deselecting options in the Show area, or by hiding specific items or changing their position on the map. You can reposition the map by dragging it, and zoom in or out of the map or its particular section. Display Storage Maps For any inventory object except networking, you can display storage maps that graphically represent the relationships between the object, for example, a virtual machine, and all resources, such as datastores, LUNs, hosts, and so on, available for this object. Procedure 1 Display the object in the inventory. 2 Select the object and click Storage Views > Maps. Export Storage Maps You can export maps to various graphic files, including JPEG, TIFF, and GIF. Procedure 1 Display a storage map. 2 Right-click the map and select Export Map from the menu. 3 Type a file name, type, and location. 4 Click Save. The image file is saved to the format and directory you specified. VMware, Inc. 227
-
 1
1 -
2
-
3
-
4
-
5
-
6
-
7
-
8
-
9
-
10
-
11
-
12
-
13
-
14
-
15
-
16
-
17
-
18
-
19
-
20
-
21
-
22
-
23
-
24
-
25
-
26
-
27
-
28
-
29
-
30
-
31
-
32
-
33
-
34
-
35
-
36
-
37
-
38
-
39
-
40
-
41
-
42
-
43
-
44
-
45
-
46
-
47
-
48
-
49
-
50
-
51
-
52
-
53
-
54
-
55
-
56
-
57
-
58
-
59
-
60
-
61
-
62
-
63
-
64
-
65
-
66
-
67
-
68
-
69
-
70
-
71
-
72
-
73
-
74
-
75
-
76
-
77
-
78
-
79
-
80
-
81
-
82
-
83
-
84
-
85
-
86
-
87
-
88
-
89
-
90
-
91
-
92
-
93
-
94
-
95
-
96
-
97
-
98
-
99
-
100
-
101
-
102
-
103
-
104
-
105
-
106
-
107
-
108
-
109
-
110
-
111
-
112
-
113
-
114
-
115
-
116
-
117
-
118
-
119
-
120
-
121
-
122
-
123
-
124
-
125
-
126
-
127
-
128
-
129
-
130
-
131
-
132
-
133
-
134
-
135
-
136
-
137
-
138
-
139
-
140
-
141
-
142
-
143
-
144
-
145
-
146
-
147
-
148
-
149
-
150
-
151
-
152
-
153
-
154
-
155
-
156
-
157
-
158
-
159
-
160
-
161
-
162
-
163
-
164
-
165
-
166
-
167
-
168
-
169
-
170
-
171
-
172
-
173
-
174
-
175
-
176
-
177
-
178
-
179
-
180
-
181
-
182
-
183
-
184
-
185
-
186
-
187
-
188
-
189
-
190
-
191
-
192
-
193
-
194
-
195
-
196
-
197
-
198
-
199
-
200
-
201
-
202
-
203
-
204
-
205
-
206
-
207
-
208
-
209
-
210
-
211
-
212
-
213
-
214
-
215
-
216
-
217
-
218
-
219
-
220
-
221
-
 222
222 -
 223
223 -
 224
224 -
 225
225 -
 226
226 -
 227
227 -
 228
228 -
 229
229 -
 230
230 -
 231
231 -
 232
232 -
233
-
234
-
235
-
236
-
237
-
238
-
239
-
240
-
241
-
242
-
243
-
244
-
245
-
246
-
247
-
248
-
249
-
250
-
251
-
252
-
253
-
254
-
255
-
256
-
257
-
258
-
259
-
260
-
261
-
262
-
263
-
264
-
265
-
266
-
267
-
268
-
269
-
270
-
271
-
272
-
273
-
274
-
275
-
276
-
277
-
278
-
279
-
280
-
281
-
282
-
283
-
284
-
285
-
286
-
287
-
288
-
289
-
290
-
291
-
292
-
293
-
294
-
295
-
296
-
297
-
298
-
299
-
300
-
301
-
302
-
303
-
304
-
305
-
306
-
307
-
308
-
309
-
310
-
311
-
312
-
313
-
314
-
315
-
316
-
317
-
318
-
319
-
320
-
321
-
322
-
323
-
324
-
325
-
326
-
327
-
328
-
329
-
330
-
331
-
332
-
333
-
334
-
335
-
336
-
337
-
338
-
339
-
340
-
341
-
342
-
343
-
344
-
345
-
346
-
347
-
348
-
349
-
350
-
351
-
352
-
353
-
354
-
355
-
356
-
357
-
358
-
359
-
360
-
361
-
362
-
363
-
364
 |
 |