VMware 4817V62 Administration Guide - Page 273
Monitoring and Troubleshooting Performance, CPU Performance
 |
View all VMware 4817V62 manuals
Add to My Manuals
Save this manual to your list of manuals |
Page 273 highlights
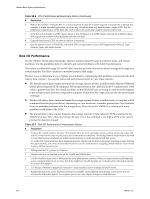
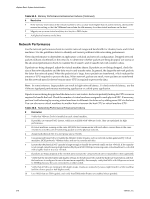
Chapter 22 Working with Performance Statistics 7 Click OK. Monitoring and Troubleshooting Performance You monitor CPU, memory, disk, network, and storage metrics by using the performance charts located on the Performance tab of the vSphere Client. Use the following guidelines to identify and resolve potential performance problems. n CPU Performance on page 273 Use the vSphere Client CPU performance charts to monitor CPU usage for hosts, clusters, resource pools, virtual machines, and vApps. Use the guidelines below to identify and correct problems with CPU performance. n Disk I/O Performance on page 274 Use the vSphere Client disk performance charts to monitor disk I/O usage for clusters, hosts, and virtual machines. Use the guidelines below to identify and correct problems with disk I/O performance. n Memory Performance on page 275 Use the vSphere Client memory performance charts to monitor memory usage of clusters, hosts, virtual machines, and vApps. Use the guidelines below to identify and correct problems with memory performance. n Network Performance on page 276 Use the network performance charts to monitor network usage and bandwidth for clusters, hosts, and virtual machines. Use the guidelines below to identify and correct problems with networking performance. n Storage Performance on page 277 Use the vSphere Client datastore performance charts to monitor datastore usage. Use the guidelines below to identify and correct problems with datastore performance. CPU Performance Use the vSphere Client CPU performance charts to monitor CPU usage for hosts, clusters, resource pools, virtual machines, and vApps. Use the guidelines below to identify and correct problems with CPU performance. A short spike in CPU usage or CPU ready indicates that you are making the best use of the host resources. However, if both values are constantly high, the hosts are probably overcommitted. Generally, if the CPU usage value for a virtual machine is above 90% and the CPU ready value is above 20%, performance is impacted. Table 22-6. CPU Performance Enhancement Advice # Resolution 1 Verify that VMware Tools is installed on every virtual machine on the host. 2 Compare the CPU usage value of a virtual machine with the CPU usage of other virtual machines on the host or in the resource pool. The stacked bar chart on the host's Virtual Machine view shows the CPU usage for all virtual machines on the host. 3 Determine whether the high ready time for the virtual machine resulted from its CPU usage time reaching the CPU limit setting. If so, increase the CPU limit on the virtual machine. 4 Increase the CPU shares to give the virtual machine more opportunities to run. The total ready time on the host might remain at the same level if the host system is constrained by CPU. If the host ready time doesn't decrease, set the CPU reservations for high-priority virtual machines to guarantee that they receive the required CPU cycles. 5 Increase the amount of memory allocated to the virtual machine. This decreases disk and or network activity for applications that cache. This might lower disk I/O and reduce the need for the ESX/ESXi host to virtualize the hardware. Virtual machines with smaller resource allocations generally accumulate more CPU ready time. VMware, Inc. 273
-
 1
1 -
2
-
3
-
4
-
5
-
6
-
7
-
8
-
9
-
10
-
11
-
12
-
13
-
14
-
15
-
16
-
17
-
18
-
19
-
20
-
21
-
22
-
23
-
24
-
25
-
26
-
27
-
28
-
29
-
30
-
31
-
32
-
33
-
34
-
35
-
36
-
37
-
38
-
39
-
40
-
41
-
42
-
43
-
44
-
45
-
46
-
47
-
48
-
49
-
50
-
51
-
52
-
53
-
54
-
55
-
56
-
57
-
58
-
59
-
60
-
61
-
62
-
63
-
64
-
65
-
66
-
67
-
68
-
69
-
70
-
71
-
72
-
73
-
74
-
75
-
76
-
77
-
78
-
79
-
80
-
81
-
82
-
83
-
84
-
85
-
86
-
87
-
88
-
89
-
90
-
91
-
92
-
93
-
94
-
95
-
96
-
97
-
98
-
99
-
100
-
101
-
102
-
103
-
104
-
105
-
106
-
107
-
108
-
109
-
110
-
111
-
112
-
113
-
114
-
115
-
116
-
117
-
118
-
119
-
120
-
121
-
122
-
123
-
124
-
125
-
126
-
127
-
128
-
129
-
130
-
131
-
132
-
133
-
134
-
135
-
136
-
137
-
138
-
139
-
140
-
141
-
142
-
143
-
144
-
145
-
146
-
147
-
148
-
149
-
150
-
151
-
152
-
153
-
154
-
155
-
156
-
157
-
158
-
159
-
160
-
161
-
162
-
163
-
164
-
165
-
166
-
167
-
168
-
169
-
170
-
171
-
172
-
173
-
174
-
175
-
176
-
177
-
178
-
179
-
180
-
181
-
182
-
183
-
184
-
185
-
186
-
187
-
188
-
189
-
190
-
191
-
192
-
193
-
194
-
195
-
196
-
197
-
198
-
199
-
200
-
201
-
202
-
203
-
204
-
205
-
206
-
207
-
208
-
209
-
210
-
211
-
212
-
213
-
214
-
215
-
216
-
217
-
218
-
219
-
220
-
221
-
222
-
223
-
224
-
225
-
226
-
227
-
228
-
229
-
230
-
231
-
232
-
233
-
234
-
235
-
236
-
237
-
238
-
239
-
240
-
241
-
242
-
243
-
244
-
245
-
246
-
247
-
248
-
249
-
250
-
251
-
252
-
253
-
254
-
255
-
256
-
257
-
258
-
259
-
260
-
261
-
262
-
263
-
264
-
265
-
266
-
267
-
 268
268 -
 269
269 -
 270
270 -
 271
271 -
 272
272 -
 273
273 -
 274
274 -
 275
275 -
 276
276 -
 277
277 -
 278
278 -
279
-
280
-
281
-
282
-
283
-
284
-
285
-
286
-
287
-
288
-
289
-
290
-
291
-
292
-
293
-
294
-
295
-
296
-
297
-
298
-
299
-
300
-
301
-
302
-
303
-
304
-
305
-
306
-
307
-
308
-
309
-
310
-
311
-
312
-
313
-
314
-
315
-
316
-
317
-
318
-
319
-
320
-
321
-
322
-
323
-
324
-
325
-
326
-
327
-
328
-
329
-
330
-
331
-
332
-
333
-
334
-
335
-
336
-
337
-
338
-
339
-
340
-
341
-
342
-
343
-
344
-
345
-
346
-
347
-
348
-
349
-
350
-
351
-
352
-
353
-
354
-
355
-
356
-
357
-
358
-
359
-
360
-
361
-
362
-
363
-
364
 |
 |