VMware 4817V62 Administration Guide - Page 272
Delete a Custom Advanced Chart View, Performance, Advanced, Chart Options, Custom, Apply
 |
View all VMware 4817V62 manuals
Add to My Manuals
Save this manual to your list of manuals |
Page 272 highlights
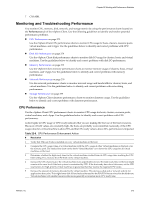
vSphere Basic System Administration Procedure 1 Display the object in the inventory. 2 Select the object and click the Performance tab. 3 Click Advanced. 4 Click Chart Options. 5 In Chart Options, select a metric group for the chart. 6 Select a time range for the metric group. If you choose Custom, do one of the following. n Select Last and set the number of hours, days, weeks, or months for the amount of time to monitor the object. n Select From and select the beginning and end dates. You can also customize the time range options by customizing the statistics collection interval setting. 7 Select the chart type. When selecting the stacked graph option, consider the following. n You can select only one item from the list of measurements. n Per-virtual-machine stacked graphs are available only for hosts. n Click a counter description name to display information about the counter's function and whether the selected metric can be stacked for per-virtual-machine graphs. 8 In Objects, select the inventory objects to display in the chart. You can also specify the objects using the All or None buttons. 9 In Counters, select the data counters to display in the chart. You can also specify counters using the All or None buttons. Click a counter name to display information about the counter in the Counter Description panel. 10 Click Apply to see the results. 11 Click OK. To view the chart in its own window, click the pop-up chart button ( ). This enables you to view additional charts while keeping this chart open. Delete a Custom Advanced Chart View You can delete custom chart views from the vSphere Client. Procedure 1 Display the vSphere Client inventory panel. 2 Select any object in the datacenter to enable the Performance tab. 3 Click the Performance tab and click Advanced. 4 Click Chart Options to open the Customize Performance Charts dialog box. 5 Click Manage Chart Settings. 6 Select a chart and click Delete. The chart is deleted, and it is removed from the Switch to menu. 272 VMware, Inc.
-
 1
1 -
2
-
3
-
4
-
5
-
6
-
7
-
8
-
9
-
10
-
11
-
12
-
13
-
14
-
15
-
16
-
17
-
18
-
19
-
20
-
21
-
22
-
23
-
24
-
25
-
26
-
27
-
28
-
29
-
30
-
31
-
32
-
33
-
34
-
35
-
36
-
37
-
38
-
39
-
40
-
41
-
42
-
43
-
44
-
45
-
46
-
47
-
48
-
49
-
50
-
51
-
52
-
53
-
54
-
55
-
56
-
57
-
58
-
59
-
60
-
61
-
62
-
63
-
64
-
65
-
66
-
67
-
68
-
69
-
70
-
71
-
72
-
73
-
74
-
75
-
76
-
77
-
78
-
79
-
80
-
81
-
82
-
83
-
84
-
85
-
86
-
87
-
88
-
89
-
90
-
91
-
92
-
93
-
94
-
95
-
96
-
97
-
98
-
99
-
100
-
101
-
102
-
103
-
104
-
105
-
106
-
107
-
108
-
109
-
110
-
111
-
112
-
113
-
114
-
115
-
116
-
117
-
118
-
119
-
120
-
121
-
122
-
123
-
124
-
125
-
126
-
127
-
128
-
129
-
130
-
131
-
132
-
133
-
134
-
135
-
136
-
137
-
138
-
139
-
140
-
141
-
142
-
143
-
144
-
145
-
146
-
147
-
148
-
149
-
150
-
151
-
152
-
153
-
154
-
155
-
156
-
157
-
158
-
159
-
160
-
161
-
162
-
163
-
164
-
165
-
166
-
167
-
168
-
169
-
170
-
171
-
172
-
173
-
174
-
175
-
176
-
177
-
178
-
179
-
180
-
181
-
182
-
183
-
184
-
185
-
186
-
187
-
188
-
189
-
190
-
191
-
192
-
193
-
194
-
195
-
196
-
197
-
198
-
199
-
200
-
201
-
202
-
203
-
204
-
205
-
206
-
207
-
208
-
209
-
210
-
211
-
212
-
213
-
214
-
215
-
216
-
217
-
218
-
219
-
220
-
221
-
222
-
223
-
224
-
225
-
226
-
227
-
228
-
229
-
230
-
231
-
232
-
233
-
234
-
235
-
236
-
237
-
238
-
239
-
240
-
241
-
242
-
243
-
244
-
245
-
246
-
247
-
248
-
249
-
250
-
251
-
252
-
253
-
254
-
255
-
256
-
257
-
258
-
259
-
260
-
261
-
262
-
263
-
264
-
265
-
266
-
 267
267 -
 268
268 -
 269
269 -
 270
270 -
 271
271 -
 272
272 -
 273
273 -
 274
274 -
 275
275 -
 276
276 -
 277
277 -
278
-
279
-
280
-
281
-
282
-
283
-
284
-
285
-
286
-
287
-
288
-
289
-
290
-
291
-
292
-
293
-
294
-
295
-
296
-
297
-
298
-
299
-
300
-
301
-
302
-
303
-
304
-
305
-
306
-
307
-
308
-
309
-
310
-
311
-
312
-
313
-
314
-
315
-
316
-
317
-
318
-
319
-
320
-
321
-
322
-
323
-
324
-
325
-
326
-
327
-
328
-
329
-
330
-
331
-
332
-
333
-
334
-
335
-
336
-
337
-
338
-
339
-
340
-
341
-
342
-
343
-
344
-
345
-
346
-
347
-
348
-
349
-
350
-
351
-
352
-
353
-
354
-
355
-
356
-
357
-
358
-
359
-
360
-
361
-
362
-
363
-
364
 |
 |