VMware 4817V62 Administration Guide - Page 269
Overview Performance Charts
 |
View all VMware 4817V62 manuals
Add to My Manuals
Save this manual to your list of manuals |
Page 269 highlights
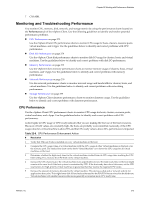
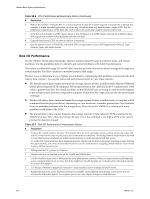
Chapter 22 Working with Performance Statistics Pie charts Stacked charts Display storage metrics for a single datastore or virtual machine. Storage information is based on file type or virtual machine. For example, a pie chart for a datastore displays the amount of storage space occupied by the fivelargest virtual machines on that datastore. A pie chart for a virtual machine displays the amount of storage space occupied by virtual machine files. Display metrics for children of the selected parent object. For example, a host's stacked CPU usage chart displays CPU usage metrics for each virtual machine on the host. The metrics for the host itself are displayed in separate line charts. Stacked charts are useful in comparing resource allocation and usage across multiple hosts or virtual machines. Each metric group appears on a separate chart for a managed entity. For example, hosts have one chart that displays CPU metrics and one that displays memory metrics. Overview Performance Charts The overview performance charts enable you to view CPU, memory, network, disk, and storage metrics for an object at the same time. All overview charts for an object appear in the same panel in the Performance tab. This allows you to do sideby-side comparisions of resource usage for clusters, datacenters, datastores, hosts, resource pools, and virtual machines. You can perform the following tasks with the overview performance charts. n View all charts for an object in one panel. The single-panel view enables you to make side-by-side comparisons of different resource statistics, for example, CPU usage and memory usage. n View real-time and historic data. n View thumbnail charts for child objects. Thumbnail charts provide a quick summary of resource usage for each child object of a datacenter, datastore, cluster, or host. n Open the overview charts for a child object by clicking the object name in the thumbnail section. View the Overview Performance Charts You can view CPU, memory, disk, network, and storage statistics for an object in the overview performance charts. These charts support a subset of data counters supported by vCenter Server. Prerequisites The vSphere Client must be connected to a vCenter Server system. Procedure 1 Display the object in the inventory. 2 Select the object and click the Performance tab. 3 Click Overview. The overview charts for the object appear. View the Overview Performance Charts Help The Performance Chart Help contains information on how to work with overview charts, including how to analyze chart data and how to set the time range for the chart data. It also describes the metric counters displayed in each overview chart. Procedure 1 Display the object in the inventory panel. 2 Select the object and click the Performance tab. VMware, Inc. 269
-
 1
1 -
2
-
3
-
4
-
5
-
6
-
7
-
8
-
9
-
10
-
11
-
12
-
13
-
14
-
15
-
16
-
17
-
18
-
19
-
20
-
21
-
22
-
23
-
24
-
25
-
26
-
27
-
28
-
29
-
30
-
31
-
32
-
33
-
34
-
35
-
36
-
37
-
38
-
39
-
40
-
41
-
42
-
43
-
44
-
45
-
46
-
47
-
48
-
49
-
50
-
51
-
52
-
53
-
54
-
55
-
56
-
57
-
58
-
59
-
60
-
61
-
62
-
63
-
64
-
65
-
66
-
67
-
68
-
69
-
70
-
71
-
72
-
73
-
74
-
75
-
76
-
77
-
78
-
79
-
80
-
81
-
82
-
83
-
84
-
85
-
86
-
87
-
88
-
89
-
90
-
91
-
92
-
93
-
94
-
95
-
96
-
97
-
98
-
99
-
100
-
101
-
102
-
103
-
104
-
105
-
106
-
107
-
108
-
109
-
110
-
111
-
112
-
113
-
114
-
115
-
116
-
117
-
118
-
119
-
120
-
121
-
122
-
123
-
124
-
125
-
126
-
127
-
128
-
129
-
130
-
131
-
132
-
133
-
134
-
135
-
136
-
137
-
138
-
139
-
140
-
141
-
142
-
143
-
144
-
145
-
146
-
147
-
148
-
149
-
150
-
151
-
152
-
153
-
154
-
155
-
156
-
157
-
158
-
159
-
160
-
161
-
162
-
163
-
164
-
165
-
166
-
167
-
168
-
169
-
170
-
171
-
172
-
173
-
174
-
175
-
176
-
177
-
178
-
179
-
180
-
181
-
182
-
183
-
184
-
185
-
186
-
187
-
188
-
189
-
190
-
191
-
192
-
193
-
194
-
195
-
196
-
197
-
198
-
199
-
200
-
201
-
202
-
203
-
204
-
205
-
206
-
207
-
208
-
209
-
210
-
211
-
212
-
213
-
214
-
215
-
216
-
217
-
218
-
219
-
220
-
221
-
222
-
223
-
224
-
225
-
226
-
227
-
228
-
229
-
230
-
231
-
232
-
233
-
234
-
235
-
236
-
237
-
238
-
239
-
240
-
241
-
242
-
243
-
244
-
245
-
246
-
247
-
248
-
249
-
250
-
251
-
252
-
253
-
254
-
255
-
256
-
257
-
258
-
259
-
260
-
261
-
262
-
263
-
 264
264 -
 265
265 -
 266
266 -
 267
267 -
 268
268 -
 269
269 -
 270
270 -
 271
271 -
 272
272 -
 273
273 -
 274
274 -
275
-
276
-
277
-
278
-
279
-
280
-
281
-
282
-
283
-
284
-
285
-
286
-
287
-
288
-
289
-
290
-
291
-
292
-
293
-
294
-
295
-
296
-
297
-
298
-
299
-
300
-
301
-
302
-
303
-
304
-
305
-
306
-
307
-
308
-
309
-
310
-
311
-
312
-
313
-
314
-
315
-
316
-
317
-
318
-
319
-
320
-
321
-
322
-
323
-
324
-
325
-
326
-
327
-
328
-
329
-
330
-
331
-
332
-
333
-
334
-
335
-
336
-
337
-
338
-
339
-
340
-
341
-
342
-
343
-
344
-
345
-
346
-
347
-
348
-
349
-
350
-
351
-
352
-
353
-
354
-
355
-
356
-
357
-
358
-
359
-
360
-
361
-
362
-
363
-
364
 |
 |