VMware 4817V62 Administration Guide - Page 263
Collection Intervals, Table 22-2.
 |
View all VMware 4817V62 manuals
Add to My Manuals
Save this manual to your list of manuals |
Page 263 highlights
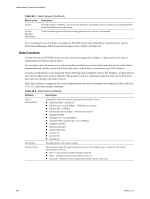
Chapter 22 Working with Performance Statistics Table 22-2. Data Counter Attributes (Continued) Attribute Description Rollup Type Calculation method used during the statistics interval to roll up data. This determines the type of statistical values that are returned for the counter. One of: n Average - Data collected during the interval is aggregated and averaged. n Minimum - The minimum value is rolled up. n Maximum - The maximum value is rolled up. The Minimum and Maximum values are collected and displayed only in collection level 4. Minimum and maximum rollup types are used to capture peaks in data during the interval. For real-time data, the value is the current minimum or current maximum. For historical data, the value is the average minimum or average maximum. For example, the following information for the CPU usage chart shows that the average is collected at collection level 1 and the minimum and maximum values are collected at collection level 4. n Counter: usage n Unit: Percentage (%) n Rollup Type: Average (Minimum/Maximum) n Collection Level: 1 (4) n Summation - Data collected is summed. The measurement displayed in the chart represents the sum of data collected during the interval. n Latest - Data collected during the interval is a set value. The value displayed in the performance charts represents the current value. Collection level Number of data counters used to collect statistics. Collection levels range from 1 to 4, with 4 having the most counters. Collection Intervals Collection intervals determine the time period during which statistics are aggregated and rolled up, and the length of time the statistics are archived in the vCenter database. By default, vCenter Server has four collection intervals: Day, Week, Month, and Year. Each interval specifies a length of a time statistics are archived in the vCenter database. You can configure which intervals are enabled and for what period of time. You can also configure the number of data counters used during a collection interval by setting the collection level. Together, the collection interval and collection level determine how much statistical data is collected and stored in your vCenter Server database. Real-time statistics are not stored in the database. They are stored in a flat file on ESX/ESXi hosts and in memory on the vCenter Server systems. ESX/ESXi hosts collect real-time statistics only for the host or the virtual machines available on the host. Real-time statistics are collected directly on an ESX/ESXi host every 20 seconds (60 seconds for ESX Server 2.x hosts). If you query for real-time statistics in the vSphere Client for performance charts, vCenter Server queries each host directly for the data. It does not process the data at this point. It only passes the data to the vSphere Client. The processing occurs in a separate operation. On ESX/ESXi hosts, the statistics are kept for one hour, after which 180 data points (15 -20 second samples) will have been collected. The data points are aggregated, processed, and returned to vCenter Server. At this point, vCenter Server archives the data in the database as a data point for the Day collection interval. To ensure performance is not impaired when collecting and writing the data to the database, cyclical queries are used to collect data counter statistics. The queries occur for a specified collection interval. At the end of each interval, the data calculation occurs. Table 22-3 lists the default collection intervals available for the vCenter Server. VMware, Inc. 263
-
 1
1 -
2
-
3
-
4
-
5
-
6
-
7
-
8
-
9
-
10
-
11
-
12
-
13
-
14
-
15
-
16
-
17
-
18
-
19
-
20
-
21
-
22
-
23
-
24
-
25
-
26
-
27
-
28
-
29
-
30
-
31
-
32
-
33
-
34
-
35
-
36
-
37
-
38
-
39
-
40
-
41
-
42
-
43
-
44
-
45
-
46
-
47
-
48
-
49
-
50
-
51
-
52
-
53
-
54
-
55
-
56
-
57
-
58
-
59
-
60
-
61
-
62
-
63
-
64
-
65
-
66
-
67
-
68
-
69
-
70
-
71
-
72
-
73
-
74
-
75
-
76
-
77
-
78
-
79
-
80
-
81
-
82
-
83
-
84
-
85
-
86
-
87
-
88
-
89
-
90
-
91
-
92
-
93
-
94
-
95
-
96
-
97
-
98
-
99
-
100
-
101
-
102
-
103
-
104
-
105
-
106
-
107
-
108
-
109
-
110
-
111
-
112
-
113
-
114
-
115
-
116
-
117
-
118
-
119
-
120
-
121
-
122
-
123
-
124
-
125
-
126
-
127
-
128
-
129
-
130
-
131
-
132
-
133
-
134
-
135
-
136
-
137
-
138
-
139
-
140
-
141
-
142
-
143
-
144
-
145
-
146
-
147
-
148
-
149
-
150
-
151
-
152
-
153
-
154
-
155
-
156
-
157
-
158
-
159
-
160
-
161
-
162
-
163
-
164
-
165
-
166
-
167
-
168
-
169
-
170
-
171
-
172
-
173
-
174
-
175
-
176
-
177
-
178
-
179
-
180
-
181
-
182
-
183
-
184
-
185
-
186
-
187
-
188
-
189
-
190
-
191
-
192
-
193
-
194
-
195
-
196
-
197
-
198
-
199
-
200
-
201
-
202
-
203
-
204
-
205
-
206
-
207
-
208
-
209
-
210
-
211
-
212
-
213
-
214
-
215
-
216
-
217
-
218
-
219
-
220
-
221
-
222
-
223
-
224
-
225
-
226
-
227
-
228
-
229
-
230
-
231
-
232
-
233
-
234
-
235
-
236
-
237
-
238
-
239
-
240
-
241
-
242
-
243
-
244
-
245
-
246
-
247
-
248
-
249
-
250
-
251
-
252
-
253
-
254
-
255
-
256
-
257
-
 258
258 -
 259
259 -
 260
260 -
 261
261 -
 262
262 -
 263
263 -
 264
264 -
 265
265 -
 266
266 -
 267
267 -
 268
268 -
269
-
270
-
271
-
272
-
273
-
274
-
275
-
276
-
277
-
278
-
279
-
280
-
281
-
282
-
283
-
284
-
285
-
286
-
287
-
288
-
289
-
290
-
291
-
292
-
293
-
294
-
295
-
296
-
297
-
298
-
299
-
300
-
301
-
302
-
303
-
304
-
305
-
306
-
307
-
308
-
309
-
310
-
311
-
312
-
313
-
314
-
315
-
316
-
317
-
318
-
319
-
320
-
321
-
322
-
323
-
324
-
325
-
326
-
327
-
328
-
329
-
330
-
331
-
332
-
333
-
334
-
335
-
336
-
337
-
338
-
339
-
340
-
341
-
342
-
343
-
344
-
345
-
346
-
347
-
348
-
349
-
350
-
351
-
352
-
353
-
354
-
355
-
356
-
357
-
358
-
359
-
360
-
361
-
362
-
363
-
364
 |
 |