VMware 4817V62 Administration Guide - Page 237
Host Condition and State Triggers, Table 21-4.
 |
View all VMware 4817V62 manuals
Add to My Manuals
Save this manual to your list of manuals |
Page 237 highlights
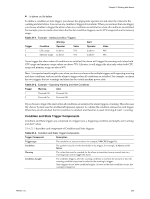
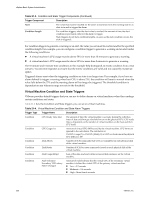
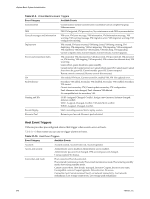
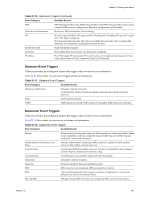
Chapter 21 Working with Alarms Table 21-4. Virtual Machine Condition and State Alarm Triggers (Continued) Trigger Type Trigger Name Description State Heartbeat Current status of the guest operating system heartbeat: n Gray - VMware Tools are not installed or not running. n Red - No heartbeat. Guest operating system may have stopped responding. n Yellow - Intermittent heartbeat. A Yellow status may be caused by heavy guest OS usage. n Green - Guest operating system is responding normally. Condition Memory Usage (%) Amount of configured RAM (MB) used by the virtual machine. The calculation is: VM Memory Usage (%) = Active Memory [MB] / configured RAM of VM [MB] x 100 Condition Network Usage (Kbps) Sum of data transmitted and received across all virtual NIC instances on the virtual machine. Condition Snapshot Size (GB) Aggregate size (KB) of all snapshots taken for the current virtual machine. State State Current state of the virtual machine: n Powered On - The virtual machine is powered on. n Powered Off - The virtual machine is powered off. n Suspended - The virtual machine is suspended. Condition Total Disk Latency (ms) Average amount of time taken to process a SCSI command issued by the Guest OS to the virtual machine. The calculation is: Total Disk Latency = kernelLatency + deviceLatency n Low - 0-2 seconds n Moderate - 2-6 seconds n High - More than 6 seconds Condition Total Size on Disk (GB) Aggregate amount of disk space occupied by all virtual machines on the host. Host Condition and State Triggers VMware provides preconfigured alarms that trigger when hosts undergo certain conditions and states. Table 21-5 lists the default Condition and State triggers you can set on hosts. Table 21-5. Host Condition and State Triggers Trigger Name Description Trigger Type Connection State Console SwapIn Rate (KBps) Current connection state of the host: n Connected - The host is connected to the server. For ESX/ESXi hosts, this is always the state. n Disconnected - A user has explicitly shut down the host. In this state, vCenter Server does not expect to receive heartbeats from the host. The next time a heartbeat is received, the host is returned to a connected state and an event is logged. n Not Responding - vCenter Server is not receiving heartbeat messages from the host. After the heartbeat messages are received again, the state automatically changes to Connected. This state is often used to trigger an alarm on the host. State Rate at which the service console kernel is swapping in memory. The Console Swapin Rate indicates memory pressure in the service console. A high value is generally a precursor to timeout operations. To fix the problem, consider adding more memory or ending the memory-intensive task. Condition VMware, Inc. 237
-
 1
1 -
2
-
3
-
4
-
5
-
6
-
7
-
8
-
9
-
10
-
11
-
12
-
13
-
14
-
15
-
16
-
17
-
18
-
19
-
20
-
21
-
22
-
23
-
24
-
25
-
26
-
27
-
28
-
29
-
30
-
31
-
32
-
33
-
34
-
35
-
36
-
37
-
38
-
39
-
40
-
41
-
42
-
43
-
44
-
45
-
46
-
47
-
48
-
49
-
50
-
51
-
52
-
53
-
54
-
55
-
56
-
57
-
58
-
59
-
60
-
61
-
62
-
63
-
64
-
65
-
66
-
67
-
68
-
69
-
70
-
71
-
72
-
73
-
74
-
75
-
76
-
77
-
78
-
79
-
80
-
81
-
82
-
83
-
84
-
85
-
86
-
87
-
88
-
89
-
90
-
91
-
92
-
93
-
94
-
95
-
96
-
97
-
98
-
99
-
100
-
101
-
102
-
103
-
104
-
105
-
106
-
107
-
108
-
109
-
110
-
111
-
112
-
113
-
114
-
115
-
116
-
117
-
118
-
119
-
120
-
121
-
122
-
123
-
124
-
125
-
126
-
127
-
128
-
129
-
130
-
131
-
132
-
133
-
134
-
135
-
136
-
137
-
138
-
139
-
140
-
141
-
142
-
143
-
144
-
145
-
146
-
147
-
148
-
149
-
150
-
151
-
152
-
153
-
154
-
155
-
156
-
157
-
158
-
159
-
160
-
161
-
162
-
163
-
164
-
165
-
166
-
167
-
168
-
169
-
170
-
171
-
172
-
173
-
174
-
175
-
176
-
177
-
178
-
179
-
180
-
181
-
182
-
183
-
184
-
185
-
186
-
187
-
188
-
189
-
190
-
191
-
192
-
193
-
194
-
195
-
196
-
197
-
198
-
199
-
200
-
201
-
202
-
203
-
204
-
205
-
206
-
207
-
208
-
209
-
210
-
211
-
212
-
213
-
214
-
215
-
216
-
217
-
218
-
219
-
220
-
221
-
222
-
223
-
224
-
225
-
226
-
227
-
228
-
229
-
230
-
231
-
 232
232 -
 233
233 -
 234
234 -
 235
235 -
 236
236 -
 237
237 -
 238
238 -
 239
239 -
 240
240 -
 241
241 -
 242
242 -
243
-
244
-
245
-
246
-
247
-
248
-
249
-
250
-
251
-
252
-
253
-
254
-
255
-
256
-
257
-
258
-
259
-
260
-
261
-
262
-
263
-
264
-
265
-
266
-
267
-
268
-
269
-
270
-
271
-
272
-
273
-
274
-
275
-
276
-
277
-
278
-
279
-
280
-
281
-
282
-
283
-
284
-
285
-
286
-
287
-
288
-
289
-
290
-
291
-
292
-
293
-
294
-
295
-
296
-
297
-
298
-
299
-
300
-
301
-
302
-
303
-
304
-
305
-
306
-
307
-
308
-
309
-
310
-
311
-
312
-
313
-
314
-
315
-
316
-
317
-
318
-
319
-
320
-
321
-
322
-
323
-
324
-
325
-
326
-
327
-
328
-
329
-
330
-
331
-
332
-
333
-
334
-
335
-
336
-
337
-
338
-
339
-
340
-
341
-
342
-
343
-
344
-
345
-
346
-
347
-
348
-
349
-
350
-
351
-
352
-
353
-
354
-
355
-
356
-
357
-
358
-
359
-
360
-
361
-
362
-
363
-
364
 |
 |