VMware 4817V62 Administration Guide - Page 325
Performance Metrics
 |
View all VMware 4817V62 manuals
Add to My Manuals
Save this manual to your list of manuals |
Page 325 highlights
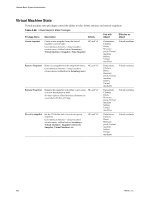
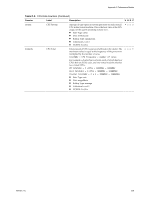
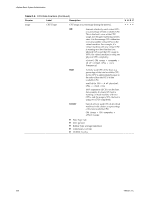
Performance Metrics C Performance metrics are collected on ESX/ESXi servers and vCenter Servers for managed objects and the physical and virtual devices associated with these objects. Each object and device has its own set of data counters that provide the metadata for the metrics. The performance metrics for VMware vSphere are organized into tables for each metric group: cluster services, CPU, disk, management agent, memory, network, system, and virtual machine operations. Each table contains the following information: Counter Label Description Stats Type Lists the display name of each data counter. Indicates the name of the data counter as displayed in the APIs and advanced performance charts. In some cases the labels are different in the overview performance charts. Provides a brief description of the metric. Measurement used during the statistics interval. The Stats Type is related to the unit of measurement and can be one of the following: n Rate - Value over the current statistics interval. n Delta - Change from previous statistics interval. n Absolute - Absolute value, independent of the statistics interval . Unit How the statistic quantity is measured across the collection interval, for example, kiloBytes (KB) and kiloBytesPerSecond (KBps). NOTE For some statistics, the value is converted before it is displayed in the overview performance charts. For example, memory usage is displayed in KiloBytes by the APIs and the advanced performance charts, but it is displayed in MegaBytes in the overview performance charts. Rollup Type Indicates the calculation method used during the statistics interval to roll up data. Determines the type of statistical values that are returned for the counter. For real-time data, the value shown is the current value. One of: n Average - Data collected is averaged. n Minimum - The minimum value collected is rolled up. n Maximum - The maximum value collected is rolled up. n Summation - Data collected is summed. n Latest - Data collected is the most recent value. VMware, Inc. 325
-
 1
1 -
2
-
3
-
4
-
5
-
6
-
7
-
8
-
9
-
10
-
11
-
12
-
13
-
14
-
15
-
16
-
17
-
18
-
19
-
20
-
21
-
22
-
23
-
24
-
25
-
26
-
27
-
28
-
29
-
30
-
31
-
32
-
33
-
34
-
35
-
36
-
37
-
38
-
39
-
40
-
41
-
42
-
43
-
44
-
45
-
46
-
47
-
48
-
49
-
50
-
51
-
52
-
53
-
54
-
55
-
56
-
57
-
58
-
59
-
60
-
61
-
62
-
63
-
64
-
65
-
66
-
67
-
68
-
69
-
70
-
71
-
72
-
73
-
74
-
75
-
76
-
77
-
78
-
79
-
80
-
81
-
82
-
83
-
84
-
85
-
86
-
87
-
88
-
89
-
90
-
91
-
92
-
93
-
94
-
95
-
96
-
97
-
98
-
99
-
100
-
101
-
102
-
103
-
104
-
105
-
106
-
107
-
108
-
109
-
110
-
111
-
112
-
113
-
114
-
115
-
116
-
117
-
118
-
119
-
120
-
121
-
122
-
123
-
124
-
125
-
126
-
127
-
128
-
129
-
130
-
131
-
132
-
133
-
134
-
135
-
136
-
137
-
138
-
139
-
140
-
141
-
142
-
143
-
144
-
145
-
146
-
147
-
148
-
149
-
150
-
151
-
152
-
153
-
154
-
155
-
156
-
157
-
158
-
159
-
160
-
161
-
162
-
163
-
164
-
165
-
166
-
167
-
168
-
169
-
170
-
171
-
172
-
173
-
174
-
175
-
176
-
177
-
178
-
179
-
180
-
181
-
182
-
183
-
184
-
185
-
186
-
187
-
188
-
189
-
190
-
191
-
192
-
193
-
194
-
195
-
196
-
197
-
198
-
199
-
200
-
201
-
202
-
203
-
204
-
205
-
206
-
207
-
208
-
209
-
210
-
211
-
212
-
213
-
214
-
215
-
216
-
217
-
218
-
219
-
220
-
221
-
222
-
223
-
224
-
225
-
226
-
227
-
228
-
229
-
230
-
231
-
232
-
233
-
234
-
235
-
236
-
237
-
238
-
239
-
240
-
241
-
242
-
243
-
244
-
245
-
246
-
247
-
248
-
249
-
250
-
251
-
252
-
253
-
254
-
255
-
256
-
257
-
258
-
259
-
260
-
261
-
262
-
263
-
264
-
265
-
266
-
267
-
268
-
269
-
270
-
271
-
272
-
273
-
274
-
275
-
276
-
277
-
278
-
279
-
280
-
281
-
282
-
283
-
284
-
285
-
286
-
287
-
288
-
289
-
290
-
291
-
292
-
293
-
294
-
295
-
296
-
297
-
298
-
299
-
300
-
301
-
302
-
303
-
304
-
305
-
306
-
307
-
308
-
309
-
310
-
311
-
312
-
313
-
314
-
315
-
316
-
317
-
318
-
319
-
 320
320 -
 321
321 -
 322
322 -
 323
323 -
 324
324 -
 325
325 -
 326
326 -
 327
327 -
 328
328 -
 329
329 -
 330
330 -
331
-
332
-
333
-
334
-
335
-
336
-
337
-
338
-
339
-
340
-
341
-
342
-
343
-
344
-
345
-
346
-
347
-
348
-
349
-
350
-
351
-
352
-
353
-
354
-
355
-
356
-
357
-
358
-
359
-
360
-
361
-
362
-
363
-
364
 |
 |