VMware 4817V62 Administration Guide - Page 270

Advanced Performance Charts

Page 270 highlights

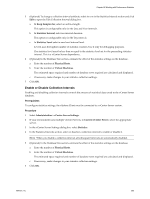
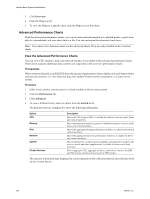
vSphere Basic System Administration 3 Click Overview. 4 Click the Help icon (?). 5 To view the Help for a specific chart, click the Help icon for that chart. Advanced Performance Charts With the advanced performance charts, you can see data point information for a plotted metric, export chart data to a spreadsheet, and save chart data to a file. You can customize the advanced chart views. NOTE You cannot view datastore metrics in the advanced charts. They are only available in the overview charts. View the Advanced Performance Charts You can view CPU, memory, disk, and network statistics for an object in the advanced performance charts. These charts support additional data counters not supported in the overview performance charts. Prerequisites When connected directly to an ESX/ESXi host, the advanced performance charts display only real-time statistics and past day statistics. To view historical data, the vSphere Client must be connected to a vCenter Server system. Procedure 1 Select a host, cluster, resource pool, or virtual machine in the inventory panel. 2 Click the Performance tab. 3 Click Advanced. 4 To view a different chart, select an option from the Switch to list. The default charts are configured to show the following information. Option CPU Memory Disk Network System Cluster Services Description Shows the CPU usage in MHz. Available for clusters, resource pools, hosts, and virtual machines. Shows the amount of memory granted. Available for clusters, resource pools, hosts, and virtual machines. Shows the aggregated storage performance statistics. Available for hosts and virtual machines. Shows the aggregated network performance statistics. Available for hosts and virtual machines. Shows statistics for overall system availability, including CPU usage by the service console and other aapplications. Available for hosts and virtual machines. Shows aggregate CPU, aggregate memory, and failover statistics for DRS and HA clusters and hosts that are part of DRS clusters. The amount of historical data displayed in a chart depends on the collection interval and collection level set for vCenter Server. 270 VMware, Inc.

  • 1
  • 2
  • 3
  • 4
  • 5
  • 6
  • 7
  • 8
  • 9
  • 10
  • 11
  • 12
  • 13
  • 14
  • 15
  • 16
  • 17
  • 18
  • 19
  • 20
  • 21
  • 22
  • 23
  • 24
  • 25
  • 26
  • 27
  • 28
  • 29
  • 30
  • 31
  • 32
  • 33
  • 34
  • 35
  • 36
  • 37
  • 38
  • 39
  • 40
  • 41
  • 42
  • 43
  • 44
  • 45
  • 46
  • 47
  • 48
  • 49
  • 50
  • 51
  • 52
  • 53
  • 54
  • 55
  • 56
  • 57
  • 58
  • 59
  • 60
  • 61
  • 62
  • 63
  • 64
  • 65
  • 66
  • 67
  • 68
  • 69
  • 70
  • 71
  • 72
  • 73
  • 74
  • 75
  • 76
  • 77
  • 78
  • 79
  • 80
  • 81
  • 82
  • 83
  • 84
  • 85
  • 86
  • 87
  • 88
  • 89
  • 90
  • 91
  • 92
  • 93
  • 94
  • 95
  • 96
  • 97
  • 98
  • 99
  • 100
  • 101
  • 102
  • 103
  • 104
  • 105
  • 106
  • 107
  • 108
  • 109
  • 110
  • 111
  • 112
  • 113
  • 114
  • 115
  • 116
  • 117
  • 118
  • 119
  • 120
  • 121
  • 122
  • 123
  • 124
  • 125
  • 126
  • 127
  • 128
  • 129
  • 130
  • 131
  • 132
  • 133
  • 134
  • 135
  • 136
  • 137
  • 138
  • 139
  • 140
  • 141
  • 142
  • 143
  • 144
  • 145
  • 146
  • 147
  • 148
  • 149
  • 150
  • 151
  • 152
  • 153
  • 154
  • 155
  • 156
  • 157
  • 158
  • 159
  • 160
  • 161
  • 162
  • 163
  • 164
  • 165
  • 166
  • 167
  • 168
  • 169
  • 170
  • 171
  • 172
  • 173
  • 174
  • 175
  • 176
  • 177
  • 178
  • 179
  • 180
  • 181
  • 182
  • 183
  • 184
  • 185
  • 186
  • 187
  • 188
  • 189
  • 190
  • 191
  • 192
  • 193
  • 194
  • 195
  • 196
  • 197
  • 198
  • 199
  • 200
  • 201
  • 202
  • 203
  • 204
  • 205
  • 206
  • 207
  • 208
  • 209
  • 210
  • 211
  • 212
  • 213
  • 214
  • 215
  • 216
  • 217
  • 218
  • 219
  • 220
  • 221
  • 222
  • 223
  • 224
  • 225
  • 226
  • 227
  • 228
  • 229
  • 230
  • 231
  • 232
  • 233
  • 234
  • 235
  • 236
  • 237
  • 238
  • 239
  • 240
  • 241
  • 242
  • 243
  • 244
  • 245
  • 246
  • 247
  • 248
  • 249
  • 250
  • 251
  • 252
  • 253
  • 254
  • 255
  • 256
  • 257
  • 258
  • 259
  • 260
  • 261
  • 262
  • 263
  • 264
  • 265
  • 266
  • 267
  • 268
  • 269
  • 270
  • 271
  • 272
  • 273
  • 274
  • 275
  • 276
  • 277
  • 278
  • 279
  • 280
  • 281
  • 282
  • 283
  • 284
  • 285
  • 286
  • 287
  • 288
  • 289
  • 290
  • 291
  • 292
  • 293
  • 294
  • 295
  • 296
  • 297
  • 298
  • 299
  • 300
  • 301
  • 302
  • 303
  • 304
  • 305
  • 306
  • 307
  • 308
  • 309
  • 310
  • 311
  • 312
  • 313
  • 314
  • 315
  • 316
  • 317
  • 318
  • 319
  • 320
  • 321
  • 322
  • 323
  • 324
  • 325
  • 326
  • 327
  • 328
  • 329
  • 330
  • 331
  • 332
  • 333
  • 334
  • 335
  • 336
  • 337
  • 338
  • 339
  • 340
  • 341
  • 342
  • 343
  • 344
  • 345
  • 346
  • 347
  • 348
  • 349
  • 350
  • 351
  • 352
  • 353
  • 354
  • 355
  • 356
  • 357
  • 358
  • 359
  • 360
  • 361
  • 362
  • 363
  • 364

3
Click
Overview
.
4
Click the Help icon (
?
).
5
To view the Help for a specific chart, click the Help icon for that chart.
Advanced Performance Charts
With the advanced performance charts, you can see data point information for a plotted metric, export chart
data to a spreadsheet, and save chart data to a file. You can customize the advanced chart views.
N
OTE
You cannot view datastore metrics in the advanced charts. They are only available in the overview
charts.
View the Advanced Performance Charts
You can view CPU, memory, disk, and network statistics for an object in the advanced performance charts.
These charts support additional data counters not supported in the overview performance charts.
Prerequisites
When connected directly to an ESX/ESXi host, the advanced performance charts display only real-time statistics
and past day statistics. To view historical data, the vSphere Client must be connected to a vCenter Server
system.
Procedure
1
Select a host, cluster, resource pool, or virtual machine in the inventory panel.
2
Click the
Performance
tab.
3
Click
Advanced
.
4
To view a different chart, select an option from the
Switch to
list.
The default charts are configured to show the following information.
Option
Description
CPU
Shows the CPU usage in MHz. Available for clusters, resource pools, hosts,
and virtual machines.
Memory
Shows the amount of memory granted. Available for clusters, resource pools,
hosts, and virtual machines.
Disk
Shows the aggregated storage performance statistics. Available for hosts and
virtual machines.
Network
Shows the aggregated network performance statistics. Available for hosts
and virtual machines.
System
Shows statistics for overall system availability, including CPU usage by the
service console and other aapplications. Available for hosts and virtual
machines.
Cluster Services
Shows aggregate CPU, aggregate memory, and failover statistics for DRS
and HA clusters and hosts that are part of DRS clusters.
The amount of historical data displayed in a chart depends on the collection interval and collection level
set for vCenter Server.
vSphere Basic System Administration
270
VMware, Inc.