VMware 4817V62 Administration Guide - Page 83
Monitoring Host Health Status, Monitor Host Health Status When Connected Directly to a Host
 |
View all VMware 4817V62 manuals
Add to My Manuals
Save this manual to your list of manuals |
Page 83 highlights
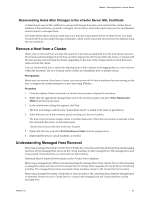
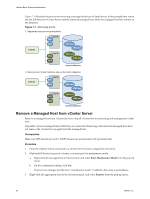
Chapter 7 Managing Hosts in vCenter Server 4 In the confirmation dialog that appears, click Yes to remove the managed host. vCenter Server removes the managed host and associated virtual machines from the vCenter Server environment. vCenter Server then returns the status of all associated processor and migration licenses to available. Monitoring Host Health Status You can use the vSphere Client to monitor the state of host hardware components, such as CPU processors, memory, fans, and other components. The host health monitoring tool allows you to monitor the health of a variety of host hardware components including: n CPU processors n Memory n Fans n Temperature n Voltage n Power n Network n Battery n Storage n Cable/Interconnect n Software components n Watchdog n Other The host health monitoring tool presents data gathered using Systems Management Architecture for Server Hardware (SMASH) profiles. The information displayed depends on the sensors available on your server hardware. You can monitor a host's health status either by connecting the vSphere Client directly to a host, or by connecting to a vCenter Server system. You can also set alarms to trigger when the host health status changes. Monitor Host Health Status When Connected Directly to a Host When you connect the vSphere Client directly to a host, you can view the health status from the host's Configuration tab. When you are connected to a host through vCenter Server, you must use the Hardware Status tab rather than the Configuration tab to monitor the host health. If a component is functioning normally, the status indicator is green. The status indicator changes to yellow or red if a system component violates a performance threshold or is not functioning properly. Generally, a yellow indicator signifies degraded performance. A red indicator signifies that a component stopped operating or exceeded the highest threshold. The Reading column displays the current values for the sensors. For instance, the column displays rotations per minute (RPM) for fans and degrees Celsius for temperature. Procedure 1 Log in to the host using the vSphere Client, and select the host in the inventory. VMware, Inc. 83
-
 1
1 -
2
-
3
-
4
-
5
-
6
-
7
-
8
-
9
-
10
-
11
-
12
-
13
-
14
-
15
-
16
-
17
-
18
-
19
-
20
-
21
-
22
-
23
-
24
-
25
-
26
-
27
-
28
-
29
-
30
-
31
-
32
-
33
-
34
-
35
-
36
-
37
-
38
-
39
-
40
-
41
-
42
-
43
-
44
-
45
-
46
-
47
-
48
-
49
-
50
-
51
-
52
-
53
-
54
-
55
-
56
-
57
-
58
-
59
-
60
-
61
-
62
-
63
-
64
-
65
-
66
-
67
-
68
-
69
-
70
-
71
-
72
-
73
-
74
-
75
-
76
-
77
-
 78
78 -
 79
79 -
 80
80 -
 81
81 -
 82
82 -
 83
83 -
 84
84 -
 85
85 -
 86
86 -
 87
87 -
 88
88 -
89
-
90
-
91
-
92
-
93
-
94
-
95
-
96
-
97
-
98
-
99
-
100
-
101
-
102
-
103
-
104
-
105
-
106
-
107
-
108
-
109
-
110
-
111
-
112
-
113
-
114
-
115
-
116
-
117
-
118
-
119
-
120
-
121
-
122
-
123
-
124
-
125
-
126
-
127
-
128
-
129
-
130
-
131
-
132
-
133
-
134
-
135
-
136
-
137
-
138
-
139
-
140
-
141
-
142
-
143
-
144
-
145
-
146
-
147
-
148
-
149
-
150
-
151
-
152
-
153
-
154
-
155
-
156
-
157
-
158
-
159
-
160
-
161
-
162
-
163
-
164
-
165
-
166
-
167
-
168
-
169
-
170
-
171
-
172
-
173
-
174
-
175
-
176
-
177
-
178
-
179
-
180
-
181
-
182
-
183
-
184
-
185
-
186
-
187
-
188
-
189
-
190
-
191
-
192
-
193
-
194
-
195
-
196
-
197
-
198
-
199
-
200
-
201
-
202
-
203
-
204
-
205
-
206
-
207
-
208
-
209
-
210
-
211
-
212
-
213
-
214
-
215
-
216
-
217
-
218
-
219
-
220
-
221
-
222
-
223
-
224
-
225
-
226
-
227
-
228
-
229
-
230
-
231
-
232
-
233
-
234
-
235
-
236
-
237
-
238
-
239
-
240
-
241
-
242
-
243
-
244
-
245
-
246
-
247
-
248
-
249
-
250
-
251
-
252
-
253
-
254
-
255
-
256
-
257
-
258
-
259
-
260
-
261
-
262
-
263
-
264
-
265
-
266
-
267
-
268
-
269
-
270
-
271
-
272
-
273
-
274
-
275
-
276
-
277
-
278
-
279
-
280
-
281
-
282
-
283
-
284
-
285
-
286
-
287
-
288
-
289
-
290
-
291
-
292
-
293
-
294
-
295
-
296
-
297
-
298
-
299
-
300
-
301
-
302
-
303
-
304
-
305
-
306
-
307
-
308
-
309
-
310
-
311
-
312
-
313
-
314
-
315
-
316
-
317
-
318
-
319
-
320
-
321
-
322
-
323
-
324
-
325
-
326
-
327
-
328
-
329
-
330
-
331
-
332
-
333
-
334
-
335
-
336
-
337
-
338
-
339
-
340
-
341
-
342
-
343
-
344
-
345
-
346
-
347
-
348
-
349
-
350
-
351
-
352
-
353
-
354
-
355
-
356
-
357
-
358
-
359
-
360
-
361
-
362
-
363
-
364
 |
 |