VMware 4817V62 Administration Guide - Page 268
Estimate the Statistics Impact on the vCenter Server Database, vCenter Server Performance Charts
 |
View all VMware 4817V62 manuals
Add to My Manuals
Save this manual to your list of manuals |
Page 268 highlights
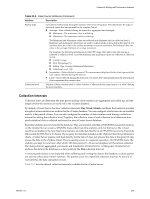
vSphere Basic System Administration Estimate the Statistics Impact on the vCenter Server Database After you configure collection intervals, you can verify that the vCenter Server database has enough space to archive the data collected. Perform the following task in the vSphere Client. Procedure 1 If necessary, open the Statistics tab of the vCenter Server Settings dialog box. a Select Administration > vCenter Server Settings. b In the navigation panel, click Statistics. 2 (Optional) Edit a statistics interval. a Select the interval to change. b Click Edit. c In the Edit Statistics Interval dialog box, change the settings as necessary. d Click OK. 3 Enter the number of physical hosts and virtual machines in your inventory. The vCenter Server uses a database calculator to determine the estimated size required for your statistics configuration. The value appears in the Estimated space required field after you enter values. 4 Click OK. vCenter Server Performance Charts The performance charts graphically display CPU, memory, disk, network, and storage metrics for devices and entities managed by vCenter Server. Chart types include line charts, pie charts, bar charts, and stacked charts. You view the performance charts for an object that is selected in the inventory on the vSphere Client Performance tab. You can view overview charts and advanced charts for an object. Both the overview charts and the advanced charts use the following chart types to display statistics: Line charts Bar charts Display metrics for a single inventory object. The data for each performance counter is plotted on a separate line in the chart. For example, a network chart for a host can contain two lines: one showing the number of packets received, and one showing the number of packets transmitted. Display storage metrics for datastores in a selected datacenter. Each datastore is represented as a bar in the chart, and each bar displays metrics based on file type (virtual disks, snapshots, swap files, and other files). 268 VMware, Inc.
-
 1
1 -
2
-
3
-
4
-
5
-
6
-
7
-
8
-
9
-
10
-
11
-
12
-
13
-
14
-
15
-
16
-
17
-
18
-
19
-
20
-
21
-
22
-
23
-
24
-
25
-
26
-
27
-
28
-
29
-
30
-
31
-
32
-
33
-
34
-
35
-
36
-
37
-
38
-
39
-
40
-
41
-
42
-
43
-
44
-
45
-
46
-
47
-
48
-
49
-
50
-
51
-
52
-
53
-
54
-
55
-
56
-
57
-
58
-
59
-
60
-
61
-
62
-
63
-
64
-
65
-
66
-
67
-
68
-
69
-
70
-
71
-
72
-
73
-
74
-
75
-
76
-
77
-
78
-
79
-
80
-
81
-
82
-
83
-
84
-
85
-
86
-
87
-
88
-
89
-
90
-
91
-
92
-
93
-
94
-
95
-
96
-
97
-
98
-
99
-
100
-
101
-
102
-
103
-
104
-
105
-
106
-
107
-
108
-
109
-
110
-
111
-
112
-
113
-
114
-
115
-
116
-
117
-
118
-
119
-
120
-
121
-
122
-
123
-
124
-
125
-
126
-
127
-
128
-
129
-
130
-
131
-
132
-
133
-
134
-
135
-
136
-
137
-
138
-
139
-
140
-
141
-
142
-
143
-
144
-
145
-
146
-
147
-
148
-
149
-
150
-
151
-
152
-
153
-
154
-
155
-
156
-
157
-
158
-
159
-
160
-
161
-
162
-
163
-
164
-
165
-
166
-
167
-
168
-
169
-
170
-
171
-
172
-
173
-
174
-
175
-
176
-
177
-
178
-
179
-
180
-
181
-
182
-
183
-
184
-
185
-
186
-
187
-
188
-
189
-
190
-
191
-
192
-
193
-
194
-
195
-
196
-
197
-
198
-
199
-
200
-
201
-
202
-
203
-
204
-
205
-
206
-
207
-
208
-
209
-
210
-
211
-
212
-
213
-
214
-
215
-
216
-
217
-
218
-
219
-
220
-
221
-
222
-
223
-
224
-
225
-
226
-
227
-
228
-
229
-
230
-
231
-
232
-
233
-
234
-
235
-
236
-
237
-
238
-
239
-
240
-
241
-
242
-
243
-
244
-
245
-
246
-
247
-
248
-
249
-
250
-
251
-
252
-
253
-
254
-
255
-
256
-
257
-
258
-
259
-
260
-
261
-
262
-
 263
263 -
 264
264 -
 265
265 -
 266
266 -
 267
267 -
 268
268 -
 269
269 -
 270
270 -
 271
271 -
 272
272 -
 273
273 -
274
-
275
-
276
-
277
-
278
-
279
-
280
-
281
-
282
-
283
-
284
-
285
-
286
-
287
-
288
-
289
-
290
-
291
-
292
-
293
-
294
-
295
-
296
-
297
-
298
-
299
-
300
-
301
-
302
-
303
-
304
-
305
-
306
-
307
-
308
-
309
-
310
-
311
-
312
-
313
-
314
-
315
-
316
-
317
-
318
-
319
-
320
-
321
-
322
-
323
-
324
-
325
-
326
-
327
-
328
-
329
-
330
-
331
-
332
-
333
-
334
-
335
-
336
-
337
-
338
-
339
-
340
-
341
-
342
-
343
-
344
-
345
-
346
-
347
-
348
-
349
-
350
-
351
-
352
-
353
-
354
-
355
-
356
-
357
-
358
-
359
-
360
-
361
-
362
-
363
-
364
 |
 |