Netgear GS418TPP User Manual - Page 389
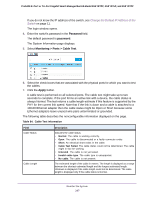
Behavior, Stop on Ful, Severity Filter, Emergency 0, Alert 1, Critical 2, Error 3, Warning 4, Notice 5
 |
View all Netgear GS418TPP manuals
Add to My Manuals
Save this manual to your list of manuals |
Page 389 highlights
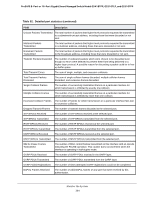
ProSAFE 8-Port or 16-Port Gigabit Smart Managed Switch Model GS418TPP, GS510TLP, and GS510TPP 7. From the Behavior menu, specify the behavior of the log when it is full. • Wrap. When the buffer is full, the oldest log messages are deleted as the system logs new messages. • Stop on Full. When the buffer is full, the system stops logging new messages and preserves all existing log messages. 8. From the Severity Filter menu, select one of the following severity levels: • Emergency (0). System is unusable. • Alert (1). Action must be taken immediately. • Critical (2). Critical conditions. • Error (3). Error conditions. • Warning (4). Warning conditions. • Notice (5). Normal but significant conditions. • Informational (6). Informational messages. • Debug (7). Debug-level messages. Note: A log records messages equal to or above a configured severity threshold. 9. Click the Apply button. The updated configuration is sent to the switch. Configuration changes take effect immediately. The Memory Log table displays on the Memory Log page. The Total number of Messages field displays the number of messages the system logged in memory. Only the 200 most recent entries are displayed on the page. The rest of the page displays the Memory Log messages. The format of the log message is the same for messages that are displayed for the message log, persistent log, or console log. Messages logged to a collector or relay through syslog support the same format as well. The following example shows the standard format for a log message: Mar 24 05:34:05 10.131.12.183-1 UNKN[2176789276]: main_login.c(179) 3855 %% HTTP Session 19 initiated for user admin connected from 10.27.64.122 The number contained in the angle brackets represents the message priority, which is derived from the following values: Priority = (facility value × 8) + severity level. The facility value is usually 1, which means it is a user-level message. Therefore, to determine the severity level of the message, subtract 8 from the number in the angle brackets. The sample log message shows a severity level of 6 (informational). For more information about the severity of a log message, see Manage the Server Log on page 392. Monitor the System 389
-
 1
1 -
2
-
3
-
4
-
5
-
6
-
7
-
8
-
9
-
10
-
11
-
12
-
13
-
14
-
15
-
16
-
17
-
18
-
19
-
20
-
21
-
22
-
23
-
24
-
25
-
26
-
27
-
28
-
29
-
30
-
31
-
32
-
33
-
34
-
35
-
36
-
37
-
38
-
39
-
40
-
41
-
42
-
43
-
44
-
45
-
46
-
47
-
48
-
49
-
50
-
51
-
52
-
53
-
54
-
55
-
56
-
57
-
58
-
59
-
60
-
61
-
62
-
63
-
64
-
65
-
66
-
67
-
68
-
69
-
70
-
71
-
72
-
73
-
74
-
75
-
76
-
77
-
78
-
79
-
80
-
81
-
82
-
83
-
84
-
85
-
86
-
87
-
88
-
89
-
90
-
91
-
92
-
93
-
94
-
95
-
96
-
97
-
98
-
99
-
100
-
101
-
102
-
103
-
104
-
105
-
106
-
107
-
108
-
109
-
110
-
111
-
112
-
113
-
114
-
115
-
116
-
117
-
118
-
119
-
120
-
121
-
122
-
123
-
124
-
125
-
126
-
127
-
128
-
129
-
130
-
131
-
132
-
133
-
134
-
135
-
136
-
137
-
138
-
139
-
140
-
141
-
142
-
143
-
144
-
145
-
146
-
147
-
148
-
149
-
150
-
151
-
152
-
153
-
154
-
155
-
156
-
157
-
158
-
159
-
160
-
161
-
162
-
163
-
164
-
165
-
166
-
167
-
168
-
169
-
170
-
171
-
172
-
173
-
174
-
175
-
176
-
177
-
178
-
179
-
180
-
181
-
182
-
183
-
184
-
185
-
186
-
187
-
188
-
189
-
190
-
191
-
192
-
193
-
194
-
195
-
196
-
197
-
198
-
199
-
200
-
201
-
202
-
203
-
204
-
205
-
206
-
207
-
208
-
209
-
210
-
211
-
212
-
213
-
214
-
215
-
216
-
217
-
218
-
219
-
220
-
221
-
222
-
223
-
224
-
225
-
226
-
227
-
228
-
229
-
230
-
231
-
232
-
233
-
234
-
235
-
236
-
237
-
238
-
239
-
240
-
241
-
242
-
243
-
244
-
245
-
246
-
247
-
248
-
249
-
250
-
251
-
252
-
253
-
254
-
255
-
256
-
257
-
258
-
259
-
260
-
261
-
262
-
263
-
264
-
265
-
266
-
267
-
268
-
269
-
270
-
271
-
272
-
273
-
274
-
275
-
276
-
277
-
278
-
279
-
280
-
281
-
282
-
283
-
284
-
285
-
286
-
287
-
288
-
289
-
290
-
291
-
292
-
293
-
294
-
295
-
296
-
297
-
298
-
299
-
300
-
301
-
302
-
303
-
304
-
305
-
306
-
307
-
308
-
309
-
310
-
311
-
312
-
313
-
314
-
315
-
316
-
317
-
318
-
319
-
320
-
321
-
322
-
323
-
324
-
325
-
326
-
327
-
328
-
329
-
330
-
331
-
332
-
333
-
334
-
335
-
336
-
337
-
338
-
339
-
340
-
341
-
342
-
343
-
344
-
345
-
346
-
347
-
348
-
349
-
350
-
351
-
352
-
353
-
354
-
355
-
356
-
357
-
358
-
359
-
360
-
361
-
362
-
363
-
364
-
365
-
366
-
367
-
368
-
369
-
370
-
371
-
372
-
373
-
374
-
375
-
376
-
377
-
378
-
379
-
380
-
381
-
382
-
383
-
 384
384 -
 385
385 -
 386
386 -
 387
387 -
 388
388 -
 389
389 -
 390
390 -
 391
391 -
 392
392 -
 393
393 -
 394
394 -
395
-
396
-
397
-
398
-
399
-
400
-
401
-
402
-
403
-
404
-
405
-
406
-
407
-
408
-
409
-
410
-
411
-
412
-
413
-
414
-
415
-
416
-
417
-
418
-
419
-
420
-
421
-
422
-
423
-
424
-
425
-
426
-
427
-
428
-
429
-
430
-
431
-
432
-
433
-
434
-
435
-
436
-
437
-
438
-
439
-
440
-
441
-
442
-
443
-
444
-
445
-
446
-
447
-
448
-
449
-
450
-
451
-
452
-
453
-
454
-
455
-
456
-
457
-
458
 |
 |