Dell Force10 S55T FTOS Command Line Reference Guide for the S55 System FTOS 8. - Page 1088
counters | details | port-stats, cpu data-plane
 |
View all Dell Force10 S55T manuals
Add to My Manuals
Save this manual to your list of manuals |
Page 1088 highlights
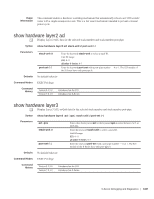
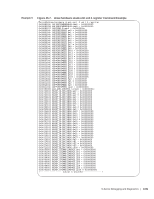
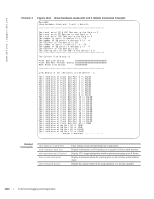
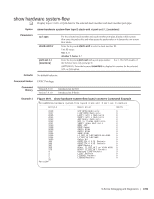
www.dell.com | support.dell.com show hardware stack-unit s Display the data plane or management plane input and output statistics of the designated component of the designated stack member. Syntax show hardware stack-unit stack-unit {cpu data-plane statistics [stack-port 0-52] | cpu party-bus statistics | drops [unit number [port 0-27]] | stack-port 0-52 | ti-monitor | unit 0-1 {counters | details | port-stats [detail] | register}} Parameters stack-unit stack-unit {command-option} cpu data-plane statistics cpu party-bus statistics drops [unit 0-1 [port 0-27]] stack-port 0-52 unit 0-1 {counters | details | port-stats [detail] | register} TI monitor Enter the keyword stack-unit to select a particular stack member and then enter one of the following command options to display a collection of data based on the option entered. Unit ID range: S55 range: 0 - 11 all other S-Series range: 0-7 Enter the keywords cpu data-plane statistics, optionally followed by the keywords stack port and its number - 0 to 52 - to display the data plane statistics, which shows the High Gig port raw input/output counter statistics to which the stacking module is connected. Enter the keywords cpu party-bus statistics, to display the Management plane input/output counter statistics of the pseudo party bus interface. Enter the drops keyword to display internal drops on the selected stack member. Optionally, use the unit keyword with 0 or 1 to select port-pipe 0 or 1, and then use port 0-27 to select a port on that port-pipe. Enter this keyword and a stacking port number to select a stacking port for which to display statistics. Identify the stack port number as you would to identify a 10G port that was in the same place in one of the rear modules. Note: You can identify stack port numbers by physical inspection of the rear modules. The numbering is the same as for the 10G ports. You can also inspect the output of the show system stack-ports command. Enter the unit keyword followed by 0 or 1 for port-pipe 0 or 1, and then enter one of the following keywords to troubleshoot errors on the selected port-pipe and to give status on why a port is not coming up to register level: counters, details, port-stats [detail], or register Enter the unit keyword to show information regarding the TI register. S55 only Defaults No default behavior Command Modes EXEC EXEC Privilege Command History Version 8.3.5.0 Version 8.3.5.0 Version 7.8.1.0 Version 7.7.1.0 Added ti-monitor information for the S55. Introduced on the S55. Modified: stack-port keyword range expanded from 49-52 to 0-52; output modified for the cpu data-plane statistics option; the following options were added: drops [unit 0-1 [port 0-27]] ; unit 0-1 {counters | details | port-stats [detail] | register} Introduced on S-Series 1088 | S-Series Debugging and Diagnostics
-
 1
1 -
2
-
3
-
4
-
5
-
6
-
7
-
8
-
9
-
10
-
11
-
12
-
13
-
14
-
15
-
16
-
17
-
18
-
19
-
20
-
21
-
22
-
23
-
24
-
25
-
26
-
27
-
28
-
29
-
30
-
31
-
32
-
33
-
34
-
35
-
36
-
37
-
38
-
39
-
40
-
41
-
42
-
43
-
44
-
45
-
46
-
47
-
48
-
49
-
50
-
51
-
52
-
53
-
54
-
55
-
56
-
57
-
58
-
59
-
60
-
61
-
62
-
63
-
64
-
65
-
66
-
67
-
68
-
69
-
70
-
71
-
72
-
73
-
74
-
75
-
76
-
77
-
78
-
79
-
80
-
81
-
82
-
83
-
84
-
85
-
86
-
87
-
88
-
89
-
90
-
91
-
92
-
93
-
94
-
95
-
96
-
97
-
98
-
99
-
100
-
101
-
102
-
103
-
104
-
105
-
106
-
107
-
108
-
109
-
110
-
111
-
112
-
113
-
114
-
115
-
116
-
117
-
118
-
119
-
120
-
121
-
122
-
123
-
124
-
125
-
126
-
127
-
128
-
129
-
130
-
131
-
132
-
133
-
134
-
135
-
136
-
137
-
138
-
139
-
140
-
141
-
142
-
143
-
144
-
145
-
146
-
147
-
148
-
149
-
150
-
151
-
152
-
153
-
154
-
155
-
156
-
157
-
158
-
159
-
160
-
161
-
162
-
163
-
164
-
165
-
166
-
167
-
168
-
169
-
170
-
171
-
172
-
173
-
174
-
175
-
176
-
177
-
178
-
179
-
180
-
181
-
182
-
183
-
184
-
185
-
186
-
187
-
188
-
189
-
190
-
191
-
192
-
193
-
194
-
195
-
196
-
197
-
198
-
199
-
200
-
201
-
202
-
203
-
204
-
205
-
206
-
207
-
208
-
209
-
210
-
211
-
212
-
213
-
214
-
215
-
216
-
217
-
218
-
219
-
220
-
221
-
222
-
223
-
224
-
225
-
226
-
227
-
228
-
229
-
230
-
231
-
232
-
233
-
234
-
235
-
236
-
237
-
238
-
239
-
240
-
241
-
242
-
243
-
244
-
245
-
246
-
247
-
248
-
249
-
250
-
251
-
252
-
253
-
254
-
255
-
256
-
257
-
258
-
259
-
260
-
261
-
262
-
263
-
264
-
265
-
266
-
267
-
268
-
269
-
270
-
271
-
272
-
273
-
274
-
275
-
276
-
277
-
278
-
279
-
280
-
281
-
282
-
283
-
284
-
285
-
286
-
287
-
288
-
289
-
290
-
291
-
292
-
293
-
294
-
295
-
296
-
297
-
298
-
299
-
300
-
301
-
302
-
303
-
304
-
305
-
306
-
307
-
308
-
309
-
310
-
311
-
312
-
313
-
314
-
315
-
316
-
317
-
318
-
319
-
320
-
321
-
322
-
323
-
324
-
325
-
326
-
327
-
328
-
329
-
330
-
331
-
332
-
333
-
334
-
335
-
336
-
337
-
338
-
339
-
340
-
341
-
342
-
343
-
344
-
345
-
346
-
347
-
348
-
349
-
350
-
351
-
352
-
353
-
354
-
355
-
356
-
357
-
358
-
359
-
360
-
361
-
362
-
363
-
364
-
365
-
366
-
367
-
368
-
369
-
370
-
371
-
372
-
373
-
374
-
375
-
376
-
377
-
378
-
379
-
380
-
381
-
382
-
383
-
384
-
385
-
386
-
387
-
388
-
389
-
390
-
391
-
392
-
393
-
394
-
395
-
396
-
397
-
398
-
399
-
400
-
401
-
402
-
403
-
404
-
405
-
406
-
407
-
408
-
409
-
410
-
411
-
412
-
413
-
414
-
415
-
416
-
417
-
418
-
419
-
420
-
421
-
422
-
423
-
424
-
425
-
426
-
427
-
428
-
429
-
430
-
431
-
432
-
433
-
434
-
435
-
436
-
437
-
438
-
439
-
440
-
441
-
442
-
443
-
444
-
445
-
446
-
447
-
448
-
449
-
450
-
451
-
452
-
453
-
454
-
455
-
456
-
457
-
458
-
459
-
460
-
461
-
462
-
463
-
464
-
465
-
466
-
467
-
468
-
469
-
470
-
471
-
472
-
473
-
474
-
475
-
476
-
477
-
478
-
479
-
480
-
481
-
482
-
483
-
484
-
485
-
486
-
487
-
488
-
489
-
490
-
491
-
492
-
493
-
494
-
495
-
496
-
497
-
498
-
499
-
500
-
501
-
502
-
503
-
504
-
505
-
506
-
507
-
508
-
509
-
510
-
511
-
512
-
513
-
514
-
515
-
516
-
517
-
518
-
519
-
520
-
521
-
522
-
523
-
524
-
525
-
526
-
527
-
528
-
529
-
530
-
531
-
532
-
533
-
534
-
535
-
536
-
537
-
538
-
539
-
540
-
541
-
542
-
543
-
544
-
545
-
546
-
547
-
548
-
549
-
550
-
551
-
552
-
553
-
554
-
555
-
556
-
557
-
558
-
559
-
560
-
561
-
562
-
563
-
564
-
565
-
566
-
567
-
568
-
569
-
570
-
571
-
572
-
573
-
574
-
575
-
576
-
577
-
578
-
579
-
580
-
581
-
582
-
583
-
584
-
585
-
586
-
587
-
588
-
589
-
590
-
591
-
592
-
593
-
594
-
595
-
596
-
597
-
598
-
599
-
600
-
601
-
602
-
603
-
604
-
605
-
606
-
607
-
608
-
609
-
610
-
611
-
612
-
613
-
614
-
615
-
616
-
617
-
618
-
619
-
620
-
621
-
622
-
623
-
624
-
625
-
626
-
627
-
628
-
629
-
630
-
631
-
632
-
633
-
634
-
635
-
636
-
637
-
638
-
639
-
640
-
641
-
642
-
643
-
644
-
645
-
646
-
647
-
648
-
649
-
650
-
651
-
652
-
653
-
654
-
655
-
656
-
657
-
658
-
659
-
660
-
661
-
662
-
663
-
664
-
665
-
666
-
667
-
668
-
669
-
670
-
671
-
672
-
673
-
674
-
675
-
676
-
677
-
678
-
679
-
680
-
681
-
682
-
683
-
684
-
685
-
686
-
687
-
688
-
689
-
690
-
691
-
692
-
693
-
694
-
695
-
696
-
697
-
698
-
699
-
700
-
701
-
702
-
703
-
704
-
705
-
706
-
707
-
708
-
709
-
710
-
711
-
712
-
713
-
714
-
715
-
716
-
717
-
718
-
719
-
720
-
721
-
722
-
723
-
724
-
725
-
726
-
727
-
728
-
729
-
730
-
731
-
732
-
733
-
734
-
735
-
736
-
737
-
738
-
739
-
740
-
741
-
742
-
743
-
744
-
745
-
746
-
747
-
748
-
749
-
750
-
751
-
752
-
753
-
754
-
755
-
756
-
757
-
758
-
759
-
760
-
761
-
762
-
763
-
764
-
765
-
766
-
767
-
768
-
769
-
770
-
771
-
772
-
773
-
774
-
775
-
776
-
777
-
778
-
779
-
780
-
781
-
782
-
783
-
784
-
785
-
786
-
787
-
788
-
789
-
790
-
791
-
792
-
793
-
794
-
795
-
796
-
797
-
798
-
799
-
800
-
801
-
802
-
803
-
804
-
805
-
806
-
807
-
808
-
809
-
810
-
811
-
812
-
813
-
814
-
815
-
816
-
817
-
818
-
819
-
820
-
821
-
822
-
823
-
824
-
825
-
826
-
827
-
828
-
829
-
830
-
831
-
832
-
833
-
834
-
835
-
836
-
837
-
838
-
839
-
840
-
841
-
842
-
843
-
844
-
845
-
846
-
847
-
848
-
849
-
850
-
851
-
852
-
853
-
854
-
855
-
856
-
857
-
858
-
859
-
860
-
861
-
862
-
863
-
864
-
865
-
866
-
867
-
868
-
869
-
870
-
871
-
872
-
873
-
874
-
875
-
876
-
877
-
878
-
879
-
880
-
881
-
882
-
883
-
884
-
885
-
886
-
887
-
888
-
889
-
890
-
891
-
892
-
893
-
894
-
895
-
896
-
897
-
898
-
899
-
900
-
901
-
902
-
903
-
904
-
905
-
906
-
907
-
908
-
909
-
910
-
911
-
912
-
913
-
914
-
915
-
916
-
917
-
918
-
919
-
920
-
921
-
922
-
923
-
924
-
925
-
926
-
927
-
928
-
929
-
930
-
931
-
932
-
933
-
934
-
935
-
936
-
937
-
938
-
939
-
940
-
941
-
942
-
943
-
944
-
945
-
946
-
947
-
948
-
949
-
950
-
951
-
952
-
953
-
954
-
955
-
956
-
957
-
958
-
959
-
960
-
961
-
962
-
963
-
964
-
965
-
966
-
967
-
968
-
969
-
970
-
971
-
972
-
973
-
974
-
975
-
976
-
977
-
978
-
979
-
980
-
981
-
982
-
983
-
984
-
985
-
986
-
987
-
988
-
989
-
990
-
991
-
992
-
993
-
994
-
995
-
996
-
997
-
998
-
999
-
1,000
-
1,001
-
1,002
-
1,003
-
1,004
-
1,005
-
1,006
-
1,007
-
1,008
-
1,009
-
1,010
-
1,011
-
1,012
-
1,013
-
1,014
-
1,015
-
1,016
-
1,017
-
1,018
-
1,019
-
1,020
-
1,021
-
1,022
-
1,023
-
1,024
-
1,025
-
1,026
-
1,027
-
1,028
-
1,029
-
1,030
-
1,031
-
1,032
-
1,033
-
1,034
-
1,035
-
1,036
-
1,037
-
1,038
-
1,039
-
1,040
-
1,041
-
1,042
-
1,043
-
1,044
-
1,045
-
1,046
-
1,047
-
1,048
-
1,049
-
1,050
-
1,051
-
1,052
-
1,053
-
1,054
-
1,055
-
1,056
-
1,057
-
1,058
-
1,059
-
1,060
-
1,061
-
1,062
-
1,063
-
1,064
-
1,065
-
1,066
-
1,067
-
1,068
-
1,069
-
1,070
-
1,071
-
1,072
-
1,073
-
1,074
-
1,075
-
1,076
-
1,077
-
1,078
-
1,079
-
1,080
-
1,081
-
1,082
-
 1,083
1,083 -
 1,084
1,084 -
 1,085
1,085 -
 1,086
1,086 -
 1,087
1,087 -
 1,088
1,088 -
 1,089
1,089 -
 1,090
1,090 -
 1,091
1,091 -
 1,092
1,092 -
 1,093
1,093 -
1,094
-
1,095
-
1,096
-
1,097
-
1,098
-
1,099
-
1,100
-
1,101
-
1,102
-
1,103
-
1,104
-
1,105
-
1,106
-
1,107
-
1,108
-
1,109
-
1,110
-
1,111
-
1,112
-
1,113
-
1,114
-
1,115
-
1,116
-
1,117
-
1,118
-
1,119
-
1,120
-
1,121
-
1,122
-
1,123
-
1,124
-
1,125
-
1,126
-
1,127
-
1,128
-
1,129
-
1,130
 |
 |