Brother International WP7550JPLUS Owner's Manual - English - Page 71
Using, Graphics, Functions
 |
View all Brother International WP7550JPLUS manuals
Add to My Manuals
Save this manual to your list of manuals |
Page 71 highlights
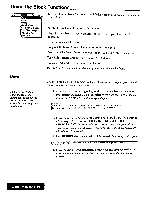
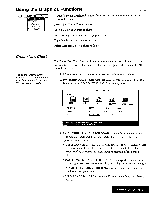
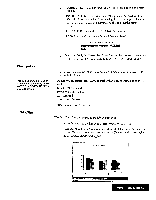
Using the Graphics Functions Block =En Option (...:reAl:E New Char! Edii Chart Line Framing Copy Graphic Delete Graphio Use the following Graphics functions from the function menu to create and edit charts and frames: Create New Chart: Creates a chart. Edit Chart: Edits an existing chart. Line Framing: Creates and edits a graphic frame. Copy Graphic: Copies a chart or frame. Delete Graphic: Deletes a chart or frame. Create New Chart You cannot insert a chart inside a multi-column format, or at a place where a "e" code or 'T" code already exists. The Create New Chart function is used to create a new chart and insert it in the document. Five types of charts are available: bar, line, pie, stacked bar, and 100% stacked bar charts. 1. Move the cursor to a line below where you wish to insert a chart. 2. Press MENU and select Graphics; then select Create New Chart from the function menu. The CHARTFORMAT window appears: TYPE: POSITION: FRAME: SIZE: « CHART FORMAT » 1O_ .41 LINE PIE 12:1122=3:1 STACKED BAR 100% STACKED BAR CENTER RIGHT THIN THICK 4.0 X 6.0INCH Press to change setting and press RETURN_ Press 1, 4 to move to another setting. 3. Use CURSOR UP and CURSOR DOWN to move from one item to the next. Use CURSOR LEFT and CURSOR RIGHT to select the desired option in each column. • TYPE: BAR / LINE I PIE I STACKED BAR / 100% STACKED BAR: To create a simple bar chart, line chart, pie chart, stacked bar chart, or 100% stacked bar chart. An icon shows an example of each type of chart. • POSITION: LEFT / CENTER I RIGHT: To align the chart with the left margin, to center between margins, or to align with the right margin. • FRAME: OFF I THIN / THICK: To select no frame, thin frame, or thick frame for your chart. • SIZE: 2.0 x 3.0 inch I 4.0 x 6.0 inch: To select one of two sizes for your charts. Word Processing 63
-
 1
1 -
2
-
3
-
4
-
5
-
6
-
7
-
8
-
9
-
10
-
11
-
12
-
13
-
14
-
15
-
16
-
17
-
18
-
19
-
20
-
21
-
22
-
23
-
24
-
25
-
26
-
27
-
28
-
29
-
30
-
31
-
32
-
33
-
34
-
35
-
36
-
37
-
38
-
39
-
40
-
41
-
42
-
43
-
44
-
45
-
46
-
47
-
48
-
49
-
50
-
51
-
52
-
53
-
54
-
55
-
56
-
57
-
58
-
59
-
60
-
61
-
62
-
63
-
64
-
65
-
 66
66 -
 67
67 -
 68
68 -
 69
69 -
 70
70 -
 71
71 -
 72
72 -
 73
73 -
 74
74 -
 75
75 -
 76
76 -
77
-
78
-
79
-
80
-
81
-
82
-
83
-
84
-
85
-
86
-
87
-
88
-
89
-
90
-
91
-
92
-
93
-
94
-
95
-
96
-
97
-
98
-
99
-
100
-
101
-
102
-
103
-
104
-
105
-
106
-
107
-
108
-
109
-
110
-
111
-
112
-
113
-
114
-
115
-
116
-
117
-
118
-
119
-
120
-
121
-
122
-
123
-
124
-
125
-
126
-
127
-
128
-
129
-
130
-
131
-
132
-
133
-
134
-
135
-
136
-
137
-
138
-
139
-
140
-
141
-
142
-
143
-
144
-
145
-
146
-
147
-
148
-
149
-
150
-
151
-
152
-
153
-
154
-
155
-
156
-
157
-
158
-
159
-
160
-
161
-
162
-
163
-
164
-
165
-
166
-
167
-
168
-
169
-
170
-
171
-
172
-
173
-
174
-
175
-
176
-
177
-
178
-
179
-
180
-
181
-
182
-
183
-
184
-
185
-
186
-
187
-
188
-
189
-
190
-
191
-
192
-
193
-
194
-
195
-
196
-
197
-
198
-
199
-
200
-
201
-
202
-
203
-
204
-
205
-
206
-
207
-
208
-
209
-
210
-
211
-
212
-
213
-
214
-
215
-
216
-
217
-
218
-
219
-
220
-
221
-
222
-
223
-
224
-
225
-
226
-
227
-
228
-
229
-
230
-
231
-
232
-
233
-
234
-
235
-
236
-
237
-
238
-
239
-
240
-
241
-
242
-
243
-
244
-
245
-
246
-
247
-
248
-
249
-
250
-
251
-
252
 |
 |