Brother International WP7550JPLUS Owner's Manual - English - Page 73
Chart, Examples
 |
View all Brother International WP7550JPLUS manuals
Add to My Manuals
Save this manual to your list of manuals |
Page 73 highlights
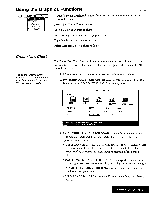
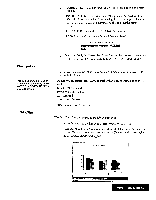
If you select YES, everything within the chart (the legend, x-axis item and all numeric data) will be cleared, but the CHART DATA window will remain on the screen. (Select NO to return to the window without deleting.) If you selected Bar, Line, Stacked Bar, or 100% Stacked Bar: LEGEND « CHART DAT A » *AXIS Type data and press CODE + RETURN. • LEGEND: A label for each row of data (example: female, male). You can have a maximum of five labels. • X-AXIS: The data that you want to appear on the x-axis will be under each bar (example: under 30, 30-50, 50+). You can input a maximum of 12 items. • Inside the grid: The numeric data is displayed as bars of relative heights. You can input a maximum of 12 sets (columns) of 5 different values. Each value can contain up to 15 digits, a decimal point and a minus sign, if necessary. Chart Examples A bar chart contains three 'flusters" of two bars, one cluster for each age bracket. With a stacked bar and 100% stacked bar chart, the two bars of each cluster will be stacked one above the other. The sample charts below show the relative proportion of employees of a company in three age brackets (under 30, 30-50, and 50+) and to separately display the numbers of female and male employees. Use the first row of the grid to show the number of female employees (example: 32, 25, 30) and the second row to show the number of male employees (example: 30, 28, 28). Bar Stacked Bar Employees 40 00 20 10 Employees 006040 - to- under SO ■ma4 00. 50+ Aqs OFernale under 80 ■riot 80.50 50+ As4 88 arnefit 100% Stacked Bar Line Word Processing 65
-
 1
1 -
2
-
3
-
4
-
5
-
6
-
7
-
8
-
9
-
10
-
11
-
12
-
13
-
14
-
15
-
16
-
17
-
18
-
19
-
20
-
21
-
22
-
23
-
24
-
25
-
26
-
27
-
28
-
29
-
30
-
31
-
32
-
33
-
34
-
35
-
36
-
37
-
38
-
39
-
40
-
41
-
42
-
43
-
44
-
45
-
46
-
47
-
48
-
49
-
50
-
51
-
52
-
53
-
54
-
55
-
56
-
57
-
58
-
59
-
60
-
61
-
62
-
63
-
64
-
65
-
66
-
67
-
 68
68 -
 69
69 -
 70
70 -
 71
71 -
 72
72 -
 73
73 -
 74
74 -
 75
75 -
 76
76 -
 77
77 -
 78
78 -
79
-
80
-
81
-
82
-
83
-
84
-
85
-
86
-
87
-
88
-
89
-
90
-
91
-
92
-
93
-
94
-
95
-
96
-
97
-
98
-
99
-
100
-
101
-
102
-
103
-
104
-
105
-
106
-
107
-
108
-
109
-
110
-
111
-
112
-
113
-
114
-
115
-
116
-
117
-
118
-
119
-
120
-
121
-
122
-
123
-
124
-
125
-
126
-
127
-
128
-
129
-
130
-
131
-
132
-
133
-
134
-
135
-
136
-
137
-
138
-
139
-
140
-
141
-
142
-
143
-
144
-
145
-
146
-
147
-
148
-
149
-
150
-
151
-
152
-
153
-
154
-
155
-
156
-
157
-
158
-
159
-
160
-
161
-
162
-
163
-
164
-
165
-
166
-
167
-
168
-
169
-
170
-
171
-
172
-
173
-
174
-
175
-
176
-
177
-
178
-
179
-
180
-
181
-
182
-
183
-
184
-
185
-
186
-
187
-
188
-
189
-
190
-
191
-
192
-
193
-
194
-
195
-
196
-
197
-
198
-
199
-
200
-
201
-
202
-
203
-
204
-
205
-
206
-
207
-
208
-
209
-
210
-
211
-
212
-
213
-
214
-
215
-
216
-
217
-
218
-
219
-
220
-
221
-
222
-
223
-
224
-
225
-
226
-
227
-
228
-
229
-
230
-
231
-
232
-
233
-
234
-
235
-
236
-
237
-
238
-
239
-
240
-
241
-
242
-
243
-
244
-
245
-
246
-
247
-
248
-
249
-
250
-
251
-
252
 |
 |
