Brother International WP7550JPLUS Owner's Manual - English - Page 75
Chart
 |
View all Brother International WP7550JPLUS manuals
Add to My Manuals
Save this manual to your list of manuals |
Page 75 highlights
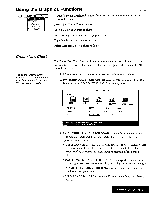
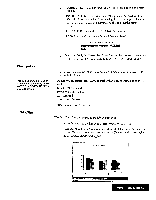
2. Use CURSOR LEFT and CURSOR RIGHT to select an option and press RETURN. • INSERT IN TEXT: A chart symbol KI appears in the dead column. The title of the chart and an icon showing the type of graph will appear in your document. You will, however, be able to print the complete chart. • PRE-STEP: Returns to the CHART DATA window. • CANCEL: Cancels the function. This window appears: OK to delete all CHART DATA? Use cursor to select and press RETURN. [NCI 3. If you select YES, the Create New Chart function is canceled and your data is lost. If you select NO, you return to the CHART FORMAT window. Final points You can go to the previous or next screen by pressing CODE ÷ PRE S or CODE + NEXT S in a setting screen. • The numeric data can consist of a maximum of 15 digits (maximum five digits after the decimal point). • Numeric values greater than 10,000 or smaller than 1 are shortened using these symbols: 10,000 10K (thousand) 10,000,000 10M (million) 0.01 10m (milli) 0.00001 101.1. (micron) • Negative values will be set as zero. Edit Chart The Edit Chart function is used to modify an existing chart. 1. Move the cursor to the line with a chart (symbol -C) to be edited. 2. Press MENU and select Graphics; then select Edit Chart from the function menu. The arrow cursor will appear next to the c symbol on the screen and the EDIT CHART window will appear:• Edit this CHART? 90 002010- .3.,dir 00 30.50 Use cursor to select and press RETURN_ 50+ Age NO1 Word Processing 67
-
 1
1 -
2
-
3
-
4
-
5
-
6
-
7
-
8
-
9
-
10
-
11
-
12
-
13
-
14
-
15
-
16
-
17
-
18
-
19
-
20
-
21
-
22
-
23
-
24
-
25
-
26
-
27
-
28
-
29
-
30
-
31
-
32
-
33
-
34
-
35
-
36
-
37
-
38
-
39
-
40
-
41
-
42
-
43
-
44
-
45
-
46
-
47
-
48
-
49
-
50
-
51
-
52
-
53
-
54
-
55
-
56
-
57
-
58
-
59
-
60
-
61
-
62
-
63
-
64
-
65
-
66
-
67
-
68
-
69
-
 70
70 -
 71
71 -
 72
72 -
 73
73 -
 74
74 -
 75
75 -
 76
76 -
 77
77 -
 78
78 -
 79
79 -
 80
80 -
81
-
82
-
83
-
84
-
85
-
86
-
87
-
88
-
89
-
90
-
91
-
92
-
93
-
94
-
95
-
96
-
97
-
98
-
99
-
100
-
101
-
102
-
103
-
104
-
105
-
106
-
107
-
108
-
109
-
110
-
111
-
112
-
113
-
114
-
115
-
116
-
117
-
118
-
119
-
120
-
121
-
122
-
123
-
124
-
125
-
126
-
127
-
128
-
129
-
130
-
131
-
132
-
133
-
134
-
135
-
136
-
137
-
138
-
139
-
140
-
141
-
142
-
143
-
144
-
145
-
146
-
147
-
148
-
149
-
150
-
151
-
152
-
153
-
154
-
155
-
156
-
157
-
158
-
159
-
160
-
161
-
162
-
163
-
164
-
165
-
166
-
167
-
168
-
169
-
170
-
171
-
172
-
173
-
174
-
175
-
176
-
177
-
178
-
179
-
180
-
181
-
182
-
183
-
184
-
185
-
186
-
187
-
188
-
189
-
190
-
191
-
192
-
193
-
194
-
195
-
196
-
197
-
198
-
199
-
200
-
201
-
202
-
203
-
204
-
205
-
206
-
207
-
208
-
209
-
210
-
211
-
212
-
213
-
214
-
215
-
216
-
217
-
218
-
219
-
220
-
221
-
222
-
223
-
224
-
225
-
226
-
227
-
228
-
229
-
230
-
231
-
232
-
233
-
234
-
235
-
236
-
237
-
238
-
239
-
240
-
241
-
242
-
243
-
244
-
245
-
246
-
247
-
248
-
249
-
250
-
251
-
252
 |
 |
