Brother International WP7550JPLUS Owner's Manual - English - Page 74
percentages.
 |
View all Brother International WP7550JPLUS manuals
Add to My Manuals
Save this manual to your list of manuals |
Page 74 highlights
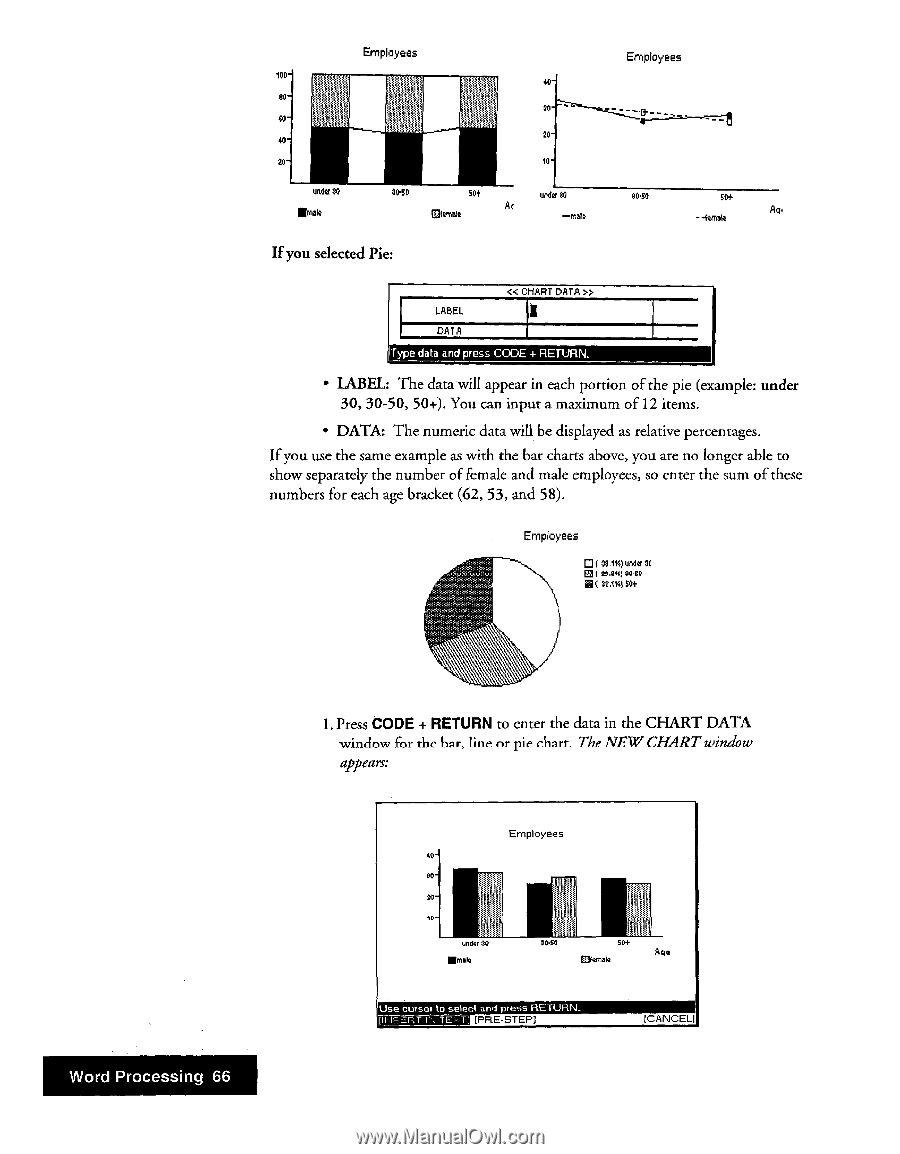
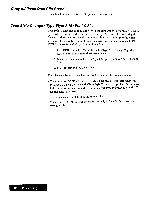
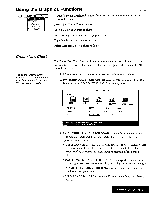
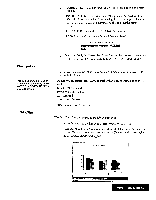
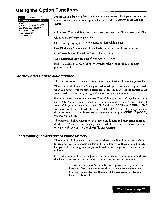
Emp oyees 10D40 80 20 00 40 20 20- la- under 30 lima% 30-50 504 Ar °knelt undo SO If you selected Pie: Employees 3040 504. As. - -Tamale LABEL DATA « CHART DATA » I Type data and press CODE + RETURN. • LABEL The data will appear in each portion of the pie (example: under 30, 30-50, 50+). You can input a maximum of 12 items. • DATA: The numeric data will be displayed as relative percentages. If you use the same example as with the bar charts above, you are no longer able to show separately the number of female and male employees, so enter the sum of these numbers for each age bracket (62, 53, and 58). Employees • 321%) undo 3C Eat 24444 9040 ▪ f SS .12q St+ Word Processing 66 1. Press CODE + RETURN to enter the data in the CHART DATA window for the hat, line or pie chart. The NEW CHART window appears: Employees 40SO - gala, 20 gotta 30.50 SO+ E3fsmats Use cursor to select and press RETURN_ IthaalaMalil [PRE-STEP] !CANCEL]
-
 1
1 -
2
-
3
-
4
-
5
-
6
-
7
-
8
-
9
-
10
-
11
-
12
-
13
-
14
-
15
-
16
-
17
-
18
-
19
-
20
-
21
-
22
-
23
-
24
-
25
-
26
-
27
-
28
-
29
-
30
-
31
-
32
-
33
-
34
-
35
-
36
-
37
-
38
-
39
-
40
-
41
-
42
-
43
-
44
-
45
-
46
-
47
-
48
-
49
-
50
-
51
-
52
-
53
-
54
-
55
-
56
-
57
-
58
-
59
-
60
-
61
-
62
-
63
-
64
-
65
-
66
-
67
-
68
-
 69
69 -
 70
70 -
 71
71 -
 72
72 -
 73
73 -
 74
74 -
 75
75 -
 76
76 -
 77
77 -
 78
78 -
 79
79 -
80
-
81
-
82
-
83
-
84
-
85
-
86
-
87
-
88
-
89
-
90
-
91
-
92
-
93
-
94
-
95
-
96
-
97
-
98
-
99
-
100
-
101
-
102
-
103
-
104
-
105
-
106
-
107
-
108
-
109
-
110
-
111
-
112
-
113
-
114
-
115
-
116
-
117
-
118
-
119
-
120
-
121
-
122
-
123
-
124
-
125
-
126
-
127
-
128
-
129
-
130
-
131
-
132
-
133
-
134
-
135
-
136
-
137
-
138
-
139
-
140
-
141
-
142
-
143
-
144
-
145
-
146
-
147
-
148
-
149
-
150
-
151
-
152
-
153
-
154
-
155
-
156
-
157
-
158
-
159
-
160
-
161
-
162
-
163
-
164
-
165
-
166
-
167
-
168
-
169
-
170
-
171
-
172
-
173
-
174
-
175
-
176
-
177
-
178
-
179
-
180
-
181
-
182
-
183
-
184
-
185
-
186
-
187
-
188
-
189
-
190
-
191
-
192
-
193
-
194
-
195
-
196
-
197
-
198
-
199
-
200
-
201
-
202
-
203
-
204
-
205
-
206
-
207
-
208
-
209
-
210
-
211
-
212
-
213
-
214
-
215
-
216
-
217
-
218
-
219
-
220
-
221
-
222
-
223
-
224
-
225
-
226
-
227
-
228
-
229
-
230
-
231
-
232
-
233
-
234
-
235
-
236
-
237
-
238
-
239
-
240
-
241
-
242
-
243
-
244
-
245
-
246
-
247
-
248
-
249
-
250
-
251
-
252
 |
 |