Brother International PDP350CJ Owner's Manual - English - Page 199
Chart Properties and Attributes, Deleting a Chart, Using a Chart in Another Application
 |
View all Brother International PDP350CJ manuals
Add to My Manuals
Save this manual to your list of manuals |
Page 199 highlights
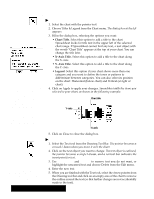
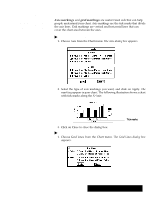
Changing Chart Properties and Attributes Attributes are visual elements such as tone, line thickness, and fill pattern. If you select a chart and then click one part of it, such as a wedge of a pie chart, you can change the attributes of that part of the chart. You can select multiple text items by holding CODE as you click. You cannot move any labels that the chart has generated, though you can edit text labels using the Text tool. "To change text properties in a chart: 1. Select the chart by clicking on it. Handles appear around the chart. 2. Select the text item within the chart that you want to change by clicking on it. Handles appear on that item to indicate it is selected. 3. Choose the text property you wish to changeĊfont, style, size, or toneĊfrom the Properties menu or the Basic Functions tool bar. Spreadsheet applies the change to the selected text. "To change an attribute of an element in a chart: 1. Select the chart by clicking on it. Handles appear around the chart. 2. Select the object within the chart that you want to change by clicking on it. Handles appear on that object to indicate it is selected. You cannot move the component parts of the chart or any labels that the chart has generated, though you can edit text labels using the Text tool. 3. Choose the attribute you wish to change from the Graphics menu. 4. Click on Apply to apply your changes. 5. Click on Close to close the dialog box. Deleting a Chart "To delete a chart: 1. If the chart is not selected, click the edge of the chart to select it. Handles appear around the chart frame and the move handle appears in the center. 2. Press DELETE. OR Choose Delete from the Edit menu. Using a Chart in Another Application You can copy a chart to a document you create with another application. For example, you may want to use a chart in a report you have created in Word Processing, or in an illustration you have created in Drawing. "To copy a chart to another application: 1. Select the chart you want to copy by clicking on it. Handles appear around the chart. 2. Choose Copy from the Edit menu. 3. Close the Spreadsheet application. The chart is pasted onto the clipboard. 4. Open the other application and choose Paste from the Edit menu. The chart appears. Spreadsheet 185
-
 1
1 -
2
-
3
-
4
-
5
-
6
-
7
-
8
-
9
-
10
-
11
-
12
-
13
-
14
-
15
-
16
-
17
-
18
-
19
-
20
-
21
-
22
-
23
-
24
-
25
-
26
-
27
-
28
-
29
-
30
-
31
-
32
-
33
-
34
-
35
-
36
-
37
-
38
-
39
-
40
-
41
-
42
-
43
-
44
-
45
-
46
-
47
-
48
-
49
-
50
-
51
-
52
-
53
-
54
-
55
-
56
-
57
-
58
-
59
-
60
-
61
-
62
-
63
-
64
-
65
-
66
-
67
-
68
-
69
-
70
-
71
-
72
-
73
-
74
-
75
-
76
-
77
-
78
-
79
-
80
-
81
-
82
-
83
-
84
-
85
-
86
-
87
-
88
-
89
-
90
-
91
-
92
-
93
-
94
-
95
-
96
-
97
-
98
-
99
-
100
-
101
-
102
-
103
-
104
-
105
-
106
-
107
-
108
-
109
-
110
-
111
-
112
-
113
-
114
-
115
-
116
-
117
-
118
-
119
-
120
-
121
-
122
-
123
-
124
-
125
-
126
-
127
-
128
-
129
-
130
-
131
-
132
-
133
-
134
-
135
-
136
-
137
-
138
-
139
-
140
-
141
-
142
-
143
-
144
-
145
-
146
-
147
-
148
-
149
-
150
-
151
-
152
-
153
-
154
-
155
-
156
-
157
-
158
-
159
-
160
-
161
-
162
-
163
-
164
-
165
-
166
-
167
-
168
-
169
-
170
-
171
-
172
-
173
-
174
-
175
-
176
-
177
-
178
-
179
-
180
-
181
-
182
-
183
-
184
-
185
-
186
-
187
-
188
-
189
-
190
-
191
-
192
-
193
-
 194
194 -
 195
195 -
 196
196 -
 197
197 -
 198
198 -
 199
199 -
 200
200 -
 201
201 -
 202
202 -
 203
203 -
 204
204 -
205
-
206
-
207
-
208
-
209
-
210
-
211
-
212
-
213
-
214
-
215
-
216
-
217
-
218
-
219
-
220
-
221
-
222
-
223
-
224
-
225
-
226
-
227
-
228
-
229
-
230
-
231
-
232
-
233
-
234
-
235
-
236
-
237
-
238
-
239
-
240
-
241
-
242
-
243
-
244
-
245
-
246
-
247
-
248
-
249
-
250
-
251
-
252
-
253
-
254
-
255
-
256
-
257
-
258
-
259
-
260
-
261
-
262
-
263
-
264
-
265
-
266
-
267
-
268
-
269
-
270
-
271
-
272
-
273
-
274
-
275
-
276
-
277
-
278
-
279
-
280
-
281
-
282
-
283
-
284
-
285
-
286
-
287
-
288
-
289
-
290
-
291
-
292
-
293
-
294
-
295
-
296
-
297
-
298
-
299
-
300
-
301
-
302
-
303
-
304
-
305
-
306
-
307
-
308
-
309
-
310
-
311
-
312
-
313
-
314
-
315
-
316
-
317
-
318
-
319
-
320
-
321
-
322
-
323
-
324
-
325
-
326
-
327
-
328
-
329
-
330
-
331
-
332
-
333
-
334
-
335
-
336
-
337
-
338
-
339
-
340
-
341
-
342
-
343
-
344
-
345
-
346
-
347
-
348
-
349
-
350
-
351
-
352
-
353
-
354
-
355
-
356
-
357
-
358
-
359
-
360
-
361
-
362
-
363
-
364
-
365
-
366
-
367
-
368
-
369
-
370
-
371
-
372
-
373
-
374
-
375
-
376
-
377
-
378
-
379
-
380
-
381
-
382
-
383
-
384
-
385
-
386
-
387
-
388
-
389
-
390
-
391
-
392
-
393
-
394
-
395
-
396
-
397
-
398
-
399
-
400
-
401
-
402
-
403
-
404
-
405
-
406
-
407
-
408
-
409
-
410
-
411
-
412
-
413
-
414
-
415
-
416
-
417
-
418
-
419
-
420
-
421
-
422
-
423
-
424
-
425
-
426
-
427
-
428
-
429
-
430
-
431
-
432
-
433
-
434
-
435
-
436
-
437
-
438
-
439
-
440
 |
 |
